239 High St Cumberland, RI 02864
Valley Falls NeighborhoodEstimated Value: $487,009 - $600,000
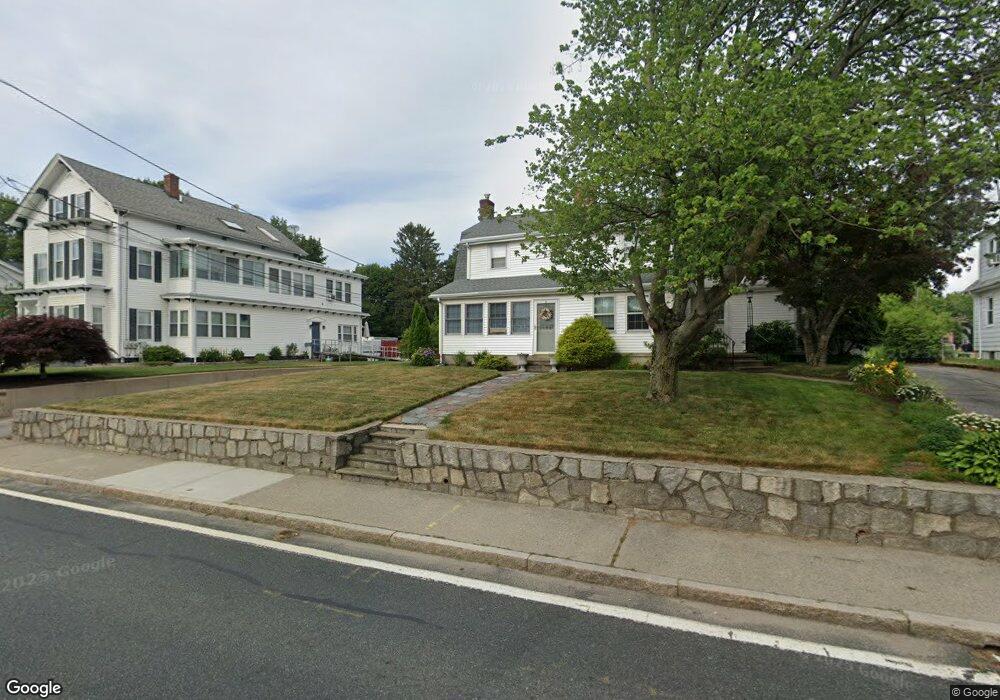
About This Home
This home is located at 239 High St, Cumberland, RI 02864 and is currently estimated at $555,752, approximately $344 per square foot. 239 High St is a home located in Providence County with nearby schools including B.F. Norton Elementary School, Joseph L. McCourt Middle School, and Cumberland High School.
Ownership History
We collect this data history from publicly available records. To have your information removed, we recommend requesting removal directly through your county’s website.
Purchase Details
Home Financials for this Owner
Home Financials are based on the most recent Mortgage that was taken out on this home.Home Values in the Area
Average Home Value in this Area
Purchase History
We collect this data history from publicly available records. To have your information removed, we recommend requesting removal directly through your county’s website.
| Date | Buyer | Sale Price | Title Company |
|---|---|---|---|
| $240,000 | -- |
Mortgage History
We collect this data history from publicly available records. To have your information removed, we recommend requesting removal directly through your county’s website.
| Date | Status | Borrower | Loan Amount |
|---|---|---|---|
| Open | $185,336 | ||
| Closed | $55,000 | ||
| Closed | $192,000 |
Tax History
We collect this data history from publicly available records. To have your information removed, we recommend requesting removal directly through your county’s website.
| Year | Tax Paid | Tax Assessment Tax Assessment Total Assessment is a certain percentage of the fair market value that is determined by local assessors to be the total taxable value of land and additions on the property. | Land | Improvement |
|---|---|---|---|---|
| 2025 | $5,276 | $430,000 | $103,100 | $326,900 |
| 2024 | $5,139 | $430,000 | $103,100 | $326,900 |
| 2023 | $5,496 | $473,000 | $103,100 | $369,900 |
| 2022 | $4,073 | $271,700 | $75,600 | $196,100 |
| 2021 | $1,539 | $104,400 | $75,600 | $28,800 |
| 2020 | $1,495 | $104,400 | $75,600 | $28,800 |
| 2019 | $3,490 | $219,800 | $65,300 | $154,500 |
| 2018 | $3,389 | $219,800 | $65,300 | $154,500 |
| 2017 | $3,343 | $219,800 | $65,300 | $154,500 |
| 2016 | $3,406 | $199,400 | $69,400 | $130,000 |
| 2015 | $3,406 | $199,400 | $69,400 | $130,000 |
| 2014 | $3,406 | $199,400 | $69,400 | $130,000 |
| 2013 | $3,688 | $233,700 | $67,800 | $165,900 |
Map
- 19 Elm St
- 11 John St
- 353 High St
- 52 John St
- 9 Kinsman St
- 7 Kinsman St
- 29 Prospect St
- 407-409 Broad St
- 417 Brown St Unit 2
- 519 Mendon Rd Unit 519
- 517 Mendon Rd Unit 517
- 32 Hopkins Terrace
- 30 Hopkins Terrace
- 63 Carpenter St
- 3 Robin Hood Ln Unit 179
- 3 Roundtable Rd
- 3 King Arthur's Ct
- 63 W Carpenter St
- 21 Citizen St
- 117 John St Unit 11
Ask me questions while you tour the home.