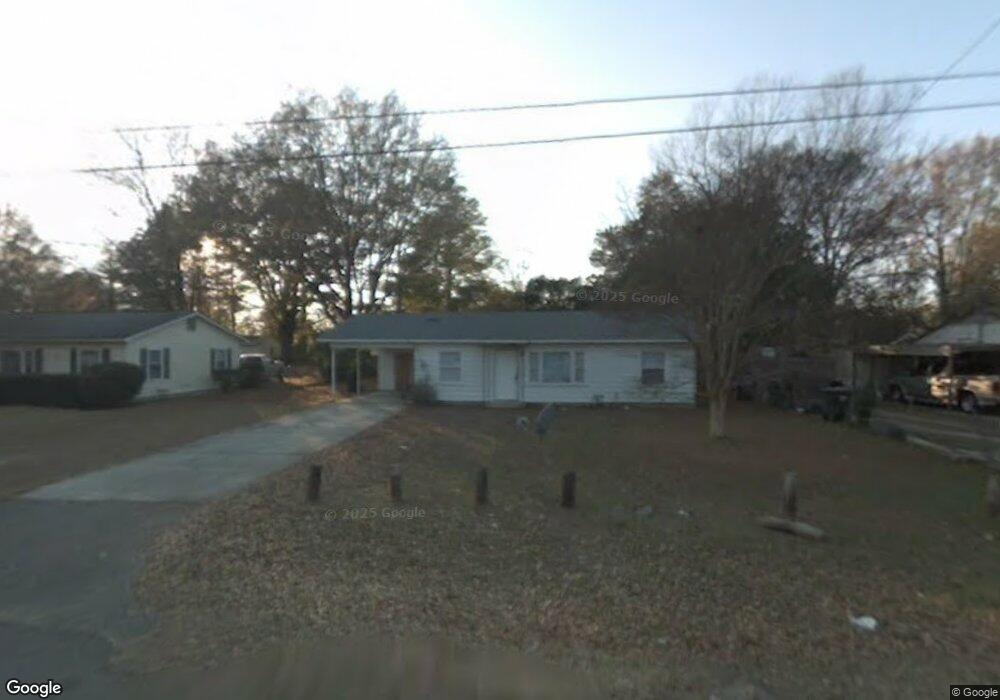
239 Johns Rd Warner Robins, GA 31093
Estimated Value: $73,523 - $106,000
Studio
1
Bath
888
Sq Ft
$104/Sq Ft
Est. Value
About This Home
This home is located at 239 Johns Rd, Warner Robins, GA 31093 and is currently estimated at $92,631, approximately $104 per square foot. 239 Johns Rd is a home located in Houston County with nearby schools including Parkwood Elementary School, Northside Middle School, and Northside High School.
Ownership History
Date
Name
Owned For
Owner Type
Purchase Details
Closed on
Nov 14, 2006
Sold by
Coleman Lisa D
Bought by
Coleman Chris B
Current Estimated Value
Home Financials for this Owner
Home Financials are based on the most recent Mortgage that was taken out on this home.
Original Mortgage
$90,114
Interest Rate
6.33%
Mortgage Type
Stand Alone Refi Refinance Of Original Loan
Purchase Details
Closed on
Jun 1, 1989
Bought by
Coleman Chris B
Create a Home Valuation Report for This Property
The Home Valuation Report is an in-depth analysis detailing your home's value as well as a comparison with similar homes in the area
Home Values in the Area
Average Home Value in this Area
Purchase History
| Date | Buyer | Sale Price | Title Company |
|---|---|---|---|
| Coleman Chris B | -- | None Available | |
| Coleman Chris B | -- | None Available | |
| Coleman Chris B | $29,500 | -- |
Source: Public Records
Mortgage History
| Date | Status | Borrower | Loan Amount |
|---|---|---|---|
| Closed | Coleman Chris B | $90,114 |
Source: Public Records
Tax History
| Year | Tax Paid | Tax Assessment Tax Assessment Total Assessment is a certain percentage of the fair market value that is determined by local assessors to be the total taxable value of land and additions on the property. | Land | Improvement |
|---|---|---|---|---|
| 2024 | $651 | $19,880 | $5,000 | $14,880 |
| 2023 | $489 | $14,840 | $2,680 | $12,160 |
| 2022 | $315 | $13,720 | $2,680 | $11,040 |
| 2021 | $279 | $12,080 | $2,680 | $9,400 |
| 2020 | $289 | $12,440 | $2,680 | $9,760 |
| 2019 | $289 | $12,440 | $2,680 | $9,760 |
| 2018 | $289 | $12,440 | $2,680 | $9,760 |
| 2017 | $289 | $12,440 | $2,680 | $9,760 |
| 2016 | $290 | $12,440 | $2,680 | $9,760 |
| 2015 | -- | $12,440 | $2,680 | $9,760 |
| 2014 | -- | $12,440 | $2,680 | $9,760 |
| 2013 | -- | $14,120 | $2,680 | $11,440 |
Source: Public Records
Map
Nearby Homes
- 249 Ward St
- 300 Ward St
- 239 Ward St
- 102 Oregon Ct
- 220 Francis St
- 302 Dunmurry Place
- 100 Mauldon Ct
- 405 Dunmurry Place
- 108 Smith Place
- 212 Dunmurry Place
- 437 Dunmurry Place
- 302 Hawaii Ave
- 714 Camellia Cir
- 202 Elmwood St
- 100 Silas Ct
- 213 King Dr
- 111 Wisconsin Ave
- 427 Alabama Ave
- 102 Camellia Cir
- 423 Alabama Ave
Your Personal Tour Guide
Ask me questions while you tour the home.