
Seller's Agent in 2026
Christine Johnson
RE/MAX
(860) 803-5915
42 in this area
431 Total Sales
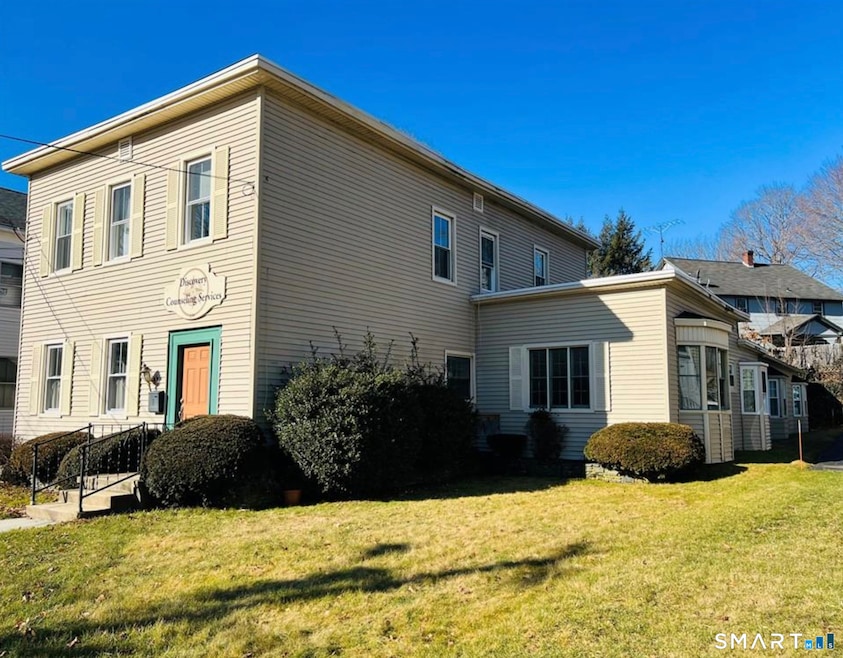
INVESTORS LOOK! One of a kind FABULOUS Mixed Use/ Residential Building with OFFICES, APARTMENTS and VISIBILITY for your Business right on Main Street! CITY WATER, SEWER and GAS! Building features a 1 Bedroom Apartment with private entrance, another PRIVATE office, as well as 3 offices with a shared sitting area and storage area and full bathroom. There is also an unfinished room upstairs that is plumbed for a kitchen could be 4 more offices OR finish it off for a 2 bedroom apartment with LAUNDRY! Off Street Parking for 5 spots. 2021 Roof $30,000 with new shingles,underlayment and ridge vent , $6000 Furnace and Hot Water Heater. NEW 2021 ELECTRICAL SERVICE (200 amps) Plumbing, METER, BRAND NEW 2025 -$30,000 replacement windows and exterior doors!! NEW BLOWN in insulation too! MAKE your own RENT and LEASES! Close to 395, Rhode Island and Mass line! Ask about the hard Money Lender that can close in a week!
Last Agent to Sell the Property
RE/MAX One Brokerage Phone: (860) 803-5915 License #RES.0764118 Listed on: 12/17/2025
| Date | Type | Sale Price | Title Company |
|---|---|---|---|
| Warranty Deed | $350,000 | -- | |
| Warranty Deed | $99,000 | -- | |
| Warranty Deed | $99,000 | -- | |
| Deed | $70,000 | -- |
| Date | Status | Loan Amount | Loan Type |
|---|---|---|---|
| Open | $330,000 | Purchase Money Mortgage | |
| Previous Owner | $74,250 | New Conventional | |
| Previous Owner | $100,000 | Commercial |
| Date | Event | Price | List to Sale | Price per Sq Ft |
|---|---|---|---|---|
| 02/05/2026 02/05/26 | Sold | $350,000 | -2.8% | $103 / Sq Ft |
| 01/17/2026 01/17/26 | Pending | -- | -- | -- |
| 01/07/2026 01/07/26 | Price Changed | $359,900 | -2.7% | $106 / Sq Ft |
| 12/17/2025 12/17/25 | For Sale | $369,900 | -- | $109 / Sq Ft |
| Year | Tax Paid | Tax Assessment Tax Assessment Total Assessment is a certain percentage of the fair market value that is determined by local assessors to be the total taxable value of land and additions on the property. | Land | Improvement |
|---|---|---|---|---|
| 2025 | $5,201 | $207,610 | $28,030 | $179,580 |
| 2024 | $2,934 | $122,710 | $39,650 | $83,060 |
| 2023 | $3,729 | $116,200 | $32,760 | $83,440 |
| 2022 | $3,508 | $116,200 | $32,760 | $83,440 |
| 2021 | $3,508 | $116,200 | $32,760 | $83,440 |
| 2020 | $3,450 | $116,200 | $32,760 | $83,440 |
| 2019 | $3,487 | $116,200 | $32,760 | $83,440 |
| 2017 | $3,841 | $119,070 | $32,760 | $86,310 |
| 2016 | $3,841 | $119,070 | $32,760 | $86,310 |
| 2015 | $3,764 | $119,070 | $32,760 | $86,310 |
| 2014 | $3,675 | $119,070 | $32,760 | $86,310 |
Seller's Agent in 2026
Christine Johnson
RE/MAX
(860) 803-5915
42 in this area
431 Total Sales
Seller Co-Listing Agent in 2026
Rachael Zagurski
RE/MAX
(860) 208-8730
2 in this area
46 Total Sales
Buyer's Agent in 2026
Lisa Therecka
Therecka & Associates LLC
(860) 377-0441
1 in this area
54 Total Sales
Source: SmartMLS
MLS Number: 24145396
APN: KILL-000181-000000-000129
Disclaimer: Certain information contained herein is derived from information provided by parties other than Homes.com. All information provided is deemed reliable, but is not guaranteed to be accurate and should be independently verified.
![]() IDX information is provided exclusively for personal, non-commercial use, and may not be used for any purpose other than to identify prospective properties consumers may be interested in purchasing. Information is deemed reliable but not guaranteed.
IDX information is provided exclusively for personal, non-commercial use, and may not be used for any purpose other than to identify prospective properties consumers may be interested in purchasing. Information is deemed reliable but not guaranteed.
Ask me questions while you tour the home.