Estimated Value: $438,287 - $544,000
3
Beds
1
Bath
1,986
Sq Ft
$249/Sq Ft
Est. Value
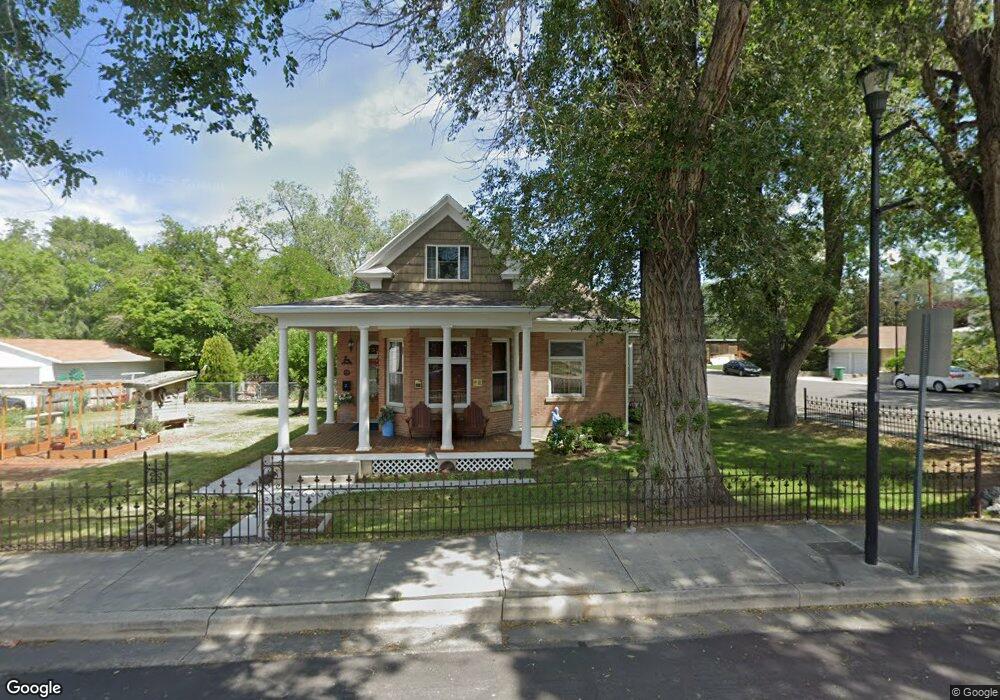
About This Home
This home is located at 239 Main St, Sandy, UT 84070 and is currently estimated at $494,572, approximately $249 per square foot. 239 Main St is a home located in Salt Lake County with nearby schools including Sandy Elementary School, Mount Jordan Middle School, and Jordan High.
Ownership History
Date
Name
Owned For
Owner Type
Purchase Details
Closed on
Jan 12, 1999
Sold by
Zuver Debra D and Dean Debra
Bought by
Zuver Milton T and Zuver Debra D
Current Estimated Value
Home Financials for this Owner
Home Financials are based on the most recent Mortgage that was taken out on this home.
Original Mortgage
$50,000
Outstanding Balance
$11,497
Interest Rate
6.66%
Estimated Equity
$483,075
Purchase Details
Closed on
May 17, 1994
Sold by
Hansen Val
Bought by
Zuver Milton T and Zuver Debra D
Home Financials for this Owner
Home Financials are based on the most recent Mortgage that was taken out on this home.
Original Mortgage
$74,650
Interest Rate
8.52%
Create a Home Valuation Report for This Property
The Home Valuation Report is an in-depth analysis detailing your home's value as well as a comparison with similar homes in the area
Home Values in the Area
Average Home Value in this Area
Purchase History
| Date | Buyer | Sale Price | Title Company |
|---|---|---|---|
| Zuver Milton T | -- | Merrill Title | |
| Zuver Milton T | -- | -- |
Source: Public Records
Mortgage History
| Date | Status | Borrower | Loan Amount |
|---|---|---|---|
| Open | Zuver Milton T | $50,000 | |
| Closed | Zuver Milton T | $74,650 |
Source: Public Records
Tax History
| Year | Tax Paid | Tax Assessment Tax Assessment Total Assessment is a certain percentage of the fair market value that is determined by local assessors to be the total taxable value of land and additions on the property. | Land | Improvement |
|---|---|---|---|---|
| 2025 | $1,782 | $402,200 | $137,100 | $265,100 |
| 2024 | $1,782 | $329,500 | $125,700 | $203,800 |
| 2023 | $1,651 | $304,400 | $119,500 | $184,900 |
| 2022 | $1,795 | $323,400 | $117,200 | $206,200 |
| 2021 | $1,704 | $261,300 | $91,700 | $169,600 |
| 2020 | $1,650 | $238,600 | $91,700 | $146,900 |
| 2019 | $1,493 | $210,400 | $91,700 | $118,700 |
| 2016 | $1,381 | $187,100 | $66,000 | $121,100 |
Source: Public Records
Map
Nearby Homes
- 270 E 8680 S
- 8558 S Center St
- 112 E 8680 S
- 412 E 8760 S
- 220 E Pioneer Ave
- 194 Pioneer Ave
- 149 E Pioneer Ave
- 227 E St Germain Way
- 8459 S 300 E
- 87 Pioneer Ave
- 8470 Solar Way
- 359 E 8400 S
- 8732 S 620 E
- 627 E 8680 S
- 87 W 8710 S
- 362 E 9150 S
- 635 Pioneer Ave
- 144 E Chambord Ct
- 140 E Chambord Ct
- 132 E Chambord Ct
Your Personal Tour Guide
Ask me questions while you tour the home.