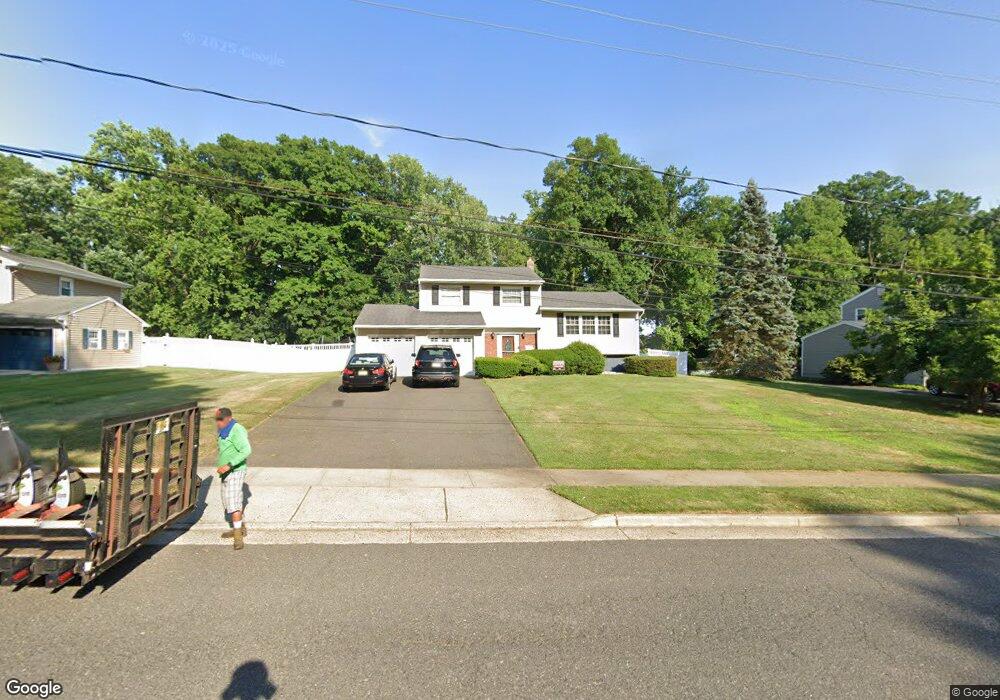
239 Matawan Ave Matawan, NJ 07747
Estimated Value: $500,000 - $652,000
3
Beds
2
Baths
1,508
Sq Ft
$393/Sq Ft
Est. Value
About This Home
This home is located at 239 Matawan Ave, Matawan, NJ 07747 and is currently estimated at $592,284, approximately $392 per square foot. 239 Matawan Ave is a home located in Monmouth County with nearby schools including Matawan Reg High School, St. Joseph Elementary School, and Icob Academy.
Ownership History
Date
Name
Owned For
Owner Type
Purchase Details
Closed on
Nov 16, 2007
Sold by
Gordon David and Gordon Pamela
Bought by
Romano Gennaro and Romano Sharon
Current Estimated Value
Home Financials for this Owner
Home Financials are based on the most recent Mortgage that was taken out on this home.
Original Mortgage
$341,905
Outstanding Balance
$215,432
Interest Rate
6.3%
Mortgage Type
Purchase Money Mortgage
Estimated Equity
$376,852
Purchase Details
Closed on
Sep 15, 2000
Sold by
Vanderbilt Daniel
Bought by
Gordon David and Gordon Pamela
Home Financials for this Owner
Home Financials are based on the most recent Mortgage that was taken out on this home.
Original Mortgage
$197,200
Interest Rate
7.83%
Create a Home Valuation Report for This Property
The Home Valuation Report is an in-depth analysis detailing your home's value as well as a comparison with similar homes in the area
Home Values in the Area
Average Home Value in this Area
Purchase History
| Date | Buyer | Sale Price | Title Company |
|---|---|---|---|
| Romano Gennaro | $359,900 | Fidelity Natl Title Ins Co | |
| Gordon David | $232,000 | -- |
Source: Public Records
Mortgage History
| Date | Status | Borrower | Loan Amount |
|---|---|---|---|
| Open | Romano Gennaro | $341,905 | |
| Previous Owner | Gordon David | $197,200 |
Source: Public Records
Tax History Compared to Growth
Tax History
| Year | Tax Paid | Tax Assessment Tax Assessment Total Assessment is a certain percentage of the fair market value that is determined by local assessors to be the total taxable value of land and additions on the property. | Land | Improvement |
|---|---|---|---|---|
| 2025 | $10,339 | $506,500 | $279,000 | $227,500 |
| 2024 | $10,059 | $473,600 | $292,500 | $181,100 |
| 2023 | $10,059 | $462,700 | $283,500 | $179,200 |
| 2022 | $8,401 | $383,900 | $213,300 | $170,600 |
| 2021 | $6,040 | $339,100 | $183,600 | $155,500 |
| 2020 | $8,980 | $328,200 | $174,600 | $153,600 |
| 2019 | $8,758 | $320,800 | $171,000 | $149,800 |
| 2018 | $8,725 | $314,400 | $166,500 | $147,900 |
| 2017 | $8,518 | $302,600 | $157,500 | $145,100 |
| 2016 | $8,163 | $296,200 | $153,000 | $143,200 |
| 2015 | $7,576 | $277,000 | $139,500 | $137,500 |
| 2014 | $7,554 | $277,200 | $135,000 | $142,200 |
Source: Public Records
Map
Nearby Homes
- 9 Fountain Ave
- 34 Oak Knoll Dr
- 4 Sutton Place
- 97D Aberdeen Rd
- 39-41 Atlantic Ave
- 18 Oak Knoll Dr
- 101 Broad St
- 7 Lucia Ct Unit 7
- 154 Lower Main St
- 26 Edgewater Dr
- 14 Dolan Ave
- 23 Mathiasen Place
- 22 Overhill Rd
- 215 Edgeview Rd
- 227 W Prospect Ave
- 258 Jackson St
- 27 Middlesex Rd
- 23 Annmar Dr
- 165 Cliffwood Ave
- 193 Cliffwood Ave