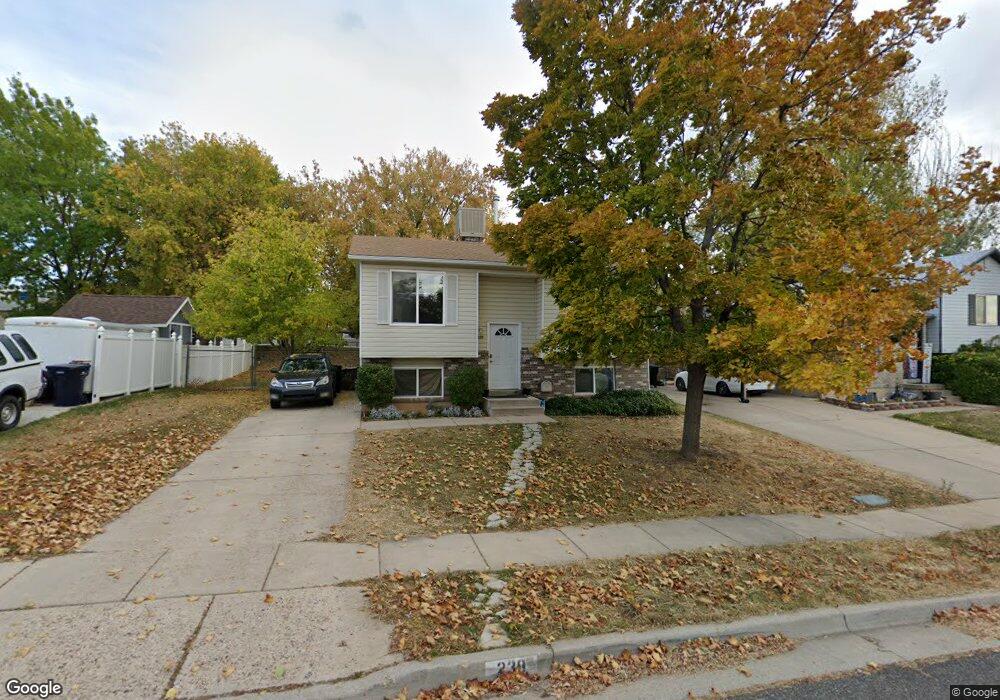
239 N 400 W Clearfield, UT 84015
Estimated Value: $358,000 - $446,000
3
Beds
1
Bath
1,544
Sq Ft
$253/Sq Ft
Est. Value
About This Home
This home is located at 239 N 400 W, Clearfield, UT 84015 and is currently estimated at $390,504, approximately $252 per square foot. 239 N 400 W is a home located in Davis County with nearby schools including Holt Elementary School, North Davis Junior High School, and Clearfield High School.
Ownership History
Date
Name
Owned For
Owner Type
Purchase Details
Closed on
May 5, 2006
Sold by
Willie Diana E
Bought by
Ligon George and Ligon Chelsea N
Current Estimated Value
Home Financials for this Owner
Home Financials are based on the most recent Mortgage that was taken out on this home.
Original Mortgage
$4,600
Outstanding Balance
$2,633
Interest Rate
6.29%
Mortgage Type
Stand Alone Second
Estimated Equity
$387,871
Purchase Details
Closed on
Jul 27, 1999
Sold by
Holst Darcie J
Bought by
Willie Diana E
Home Financials for this Owner
Home Financials are based on the most recent Mortgage that was taken out on this home.
Original Mortgage
$102,100
Interest Rate
7.64%
Purchase Details
Closed on
Feb 20, 1998
Sold by
Gaskill James H and Gaskill Wendi
Bought by
Holst Darcie J
Home Financials for this Owner
Home Financials are based on the most recent Mortgage that was taken out on this home.
Original Mortgage
$98,978
Interest Rate
6.97%
Mortgage Type
FHA
Create a Home Valuation Report for This Property
The Home Valuation Report is an in-depth analysis detailing your home's value as well as a comparison with similar homes in the area
Home Values in the Area
Average Home Value in this Area
Purchase History
| Date | Buyer | Sale Price | Title Company |
|---|---|---|---|
| Ligon George | -- | Backman Title Services | |
| Willie Diana E | -- | First American Title Ins Co | |
| Holst Darcie J | -- | U S Title |
Source: Public Records
Mortgage History
| Date | Status | Borrower | Loan Amount |
|---|---|---|---|
| Open | Ligon George | $4,600 | |
| Open | Ligon George | $104,069 | |
| Previous Owner | Willie Diana E | $102,100 | |
| Previous Owner | Holst Darcie J | $98,978 |
Source: Public Records
Tax History Compared to Growth
Tax History
| Year | Tax Paid | Tax Assessment Tax Assessment Total Assessment is a certain percentage of the fair market value that is determined by local assessors to be the total taxable value of land and additions on the property. | Land | Improvement |
|---|---|---|---|---|
| 2025 | $2,068 | $185,350 | $59,232 | $126,118 |
| 2024 | $1,998 | $180,400 | $56,713 | $123,687 |
| 2023 | $1,859 | $308,000 | $91,946 | $216,054 |
| 2022 | $1,952 | $174,900 | $53,833 | $121,067 |
| 2021 | $1,802 | $244,000 | $51,297 | $192,703 |
| 2020 | $1,562 | $210,000 | $42,112 | $167,888 |
| 2019 | $1,522 | $202,000 | $48,045 | $153,955 |
| 2018 | $1,376 | $178,000 | $42,644 | $135,356 |
| 2016 | $1,202 | $81,290 | $16,642 | $64,648 |
| 2015 | $1,148 | $73,975 | $16,642 | $57,333 |
| 2014 | $1,064 | $69,519 | $16,642 | $52,877 |
| 2013 | -- | $63,865 | $29,266 | $34,599 |
Source: Public Records
Map
Nearby Homes