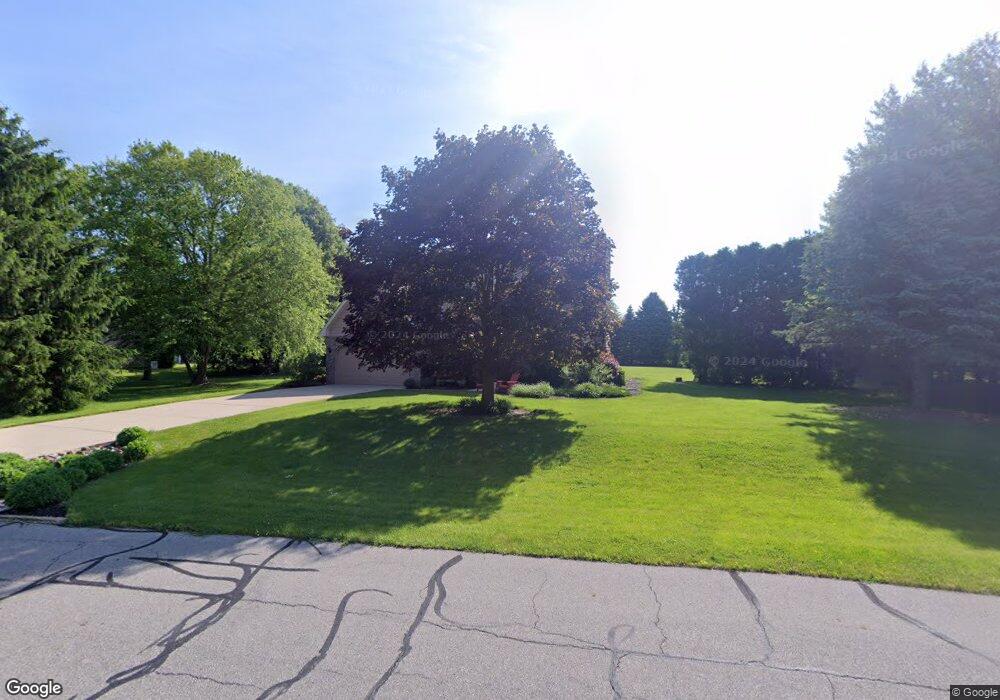
239 Norcross Dr Valparaiso, IN 46383
Porter County NeighborhoodEstimated Value: $420,241 - $546,000
4
Beds
3
Baths
2,300
Sq Ft
$203/Sq Ft
Est. Value
About This Home
This home is located at 239 Norcross Dr, Valparaiso, IN 46383 and is currently estimated at $466,310, approximately $202 per square foot. 239 Norcross Dr is a home located in Porter County with nearby schools including Morgan Township Elementary School and Morgan Township Middle/High School.
Ownership History
Date
Name
Owned For
Owner Type
Purchase Details
Closed on
Aug 26, 2011
Sold by
Bush Frank M and Bush Janet
Bought by
Bailey Jim A and Bailey Terri L
Current Estimated Value
Home Financials for this Owner
Home Financials are based on the most recent Mortgage that was taken out on this home.
Original Mortgage
$145,000
Outstanding Balance
$100,800
Interest Rate
4.58%
Mortgage Type
New Conventional
Estimated Equity
$365,510
Create a Home Valuation Report for This Property
The Home Valuation Report is an in-depth analysis detailing your home's value as well as a comparison with similar homes in the area
Home Values in the Area
Average Home Value in this Area
Purchase History
| Date | Buyer | Sale Price | Title Company |
|---|---|---|---|
| Bailey Jim A | -- | Chicago Title Insurance Co |
Source: Public Records
Mortgage History
| Date | Status | Borrower | Loan Amount |
|---|---|---|---|
| Open | Bailey Jim A | $145,000 |
Source: Public Records
Tax History Compared to Growth
Tax History
| Year | Tax Paid | Tax Assessment Tax Assessment Total Assessment is a certain percentage of the fair market value that is determined by local assessors to be the total taxable value of land and additions on the property. | Land | Improvement |
|---|---|---|---|---|
| 2024 | $2,689 | $409,900 | $46,500 | $363,400 |
| 2023 | $2,587 | $379,800 | $42,200 | $337,600 |
| 2022 | $2,447 | $340,500 | $42,200 | $298,300 |
| 2021 | $2,335 | $299,900 | $42,200 | $257,700 |
| 2020 | $2,064 | $270,100 | $36,700 | $233,400 |
| 2019 | $2,006 | $255,100 | $36,700 | $218,400 |
| 2018 | $1,867 | $242,900 | $36,700 | $206,200 |
| 2017 | $1,816 | $240,200 | $36,700 | $203,500 |
| 2016 | $1,458 | $204,200 | $33,700 | $170,500 |
| 2014 | $1,686 | $219,100 | $32,600 | $186,500 |
| 2013 | -- | $213,700 | $33,000 | $180,700 |
Source: Public Records
Map
Nearby Homes
- 239 Bayberry Ct
- 279 S State Road 49
- 232 E 250 S
- 197 Appaloosa Ln
- 195 E 400 S
- 323 E 124 S
- 355 E 300 S
- 0 Smoke Rd
- 351 S 100 W
- 48 E Division Rd
- 546 S 150 E
- 3353 Field Hawk Dr
- 3359 Blue Jay Dr
- 3251 Mockingbird Ln
- 501 Eagle Ct
- 372 Radcliff Dr
- 530 S 300 E
- 421 Amy Rose Ln
- 3152 Heavilin Rd
- 1551 Gilleevan Dr