Estimated Value: $241,000 - $272,000
3
Beds
2
Baths
1,815
Sq Ft
$141/Sq Ft
Est. Value
About This Home
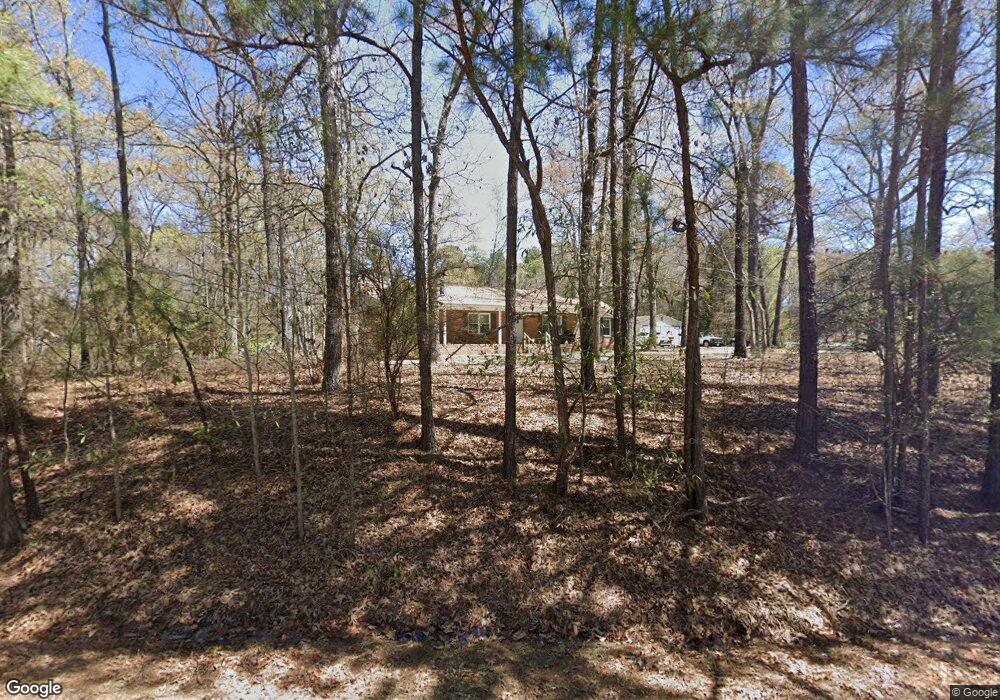
This home is located at 239 Red Oak Rd, Byron, GA 31008 and is currently estimated at $255,596, approximately $140 per square foot. 239 Red Oak Rd is a home located in Peach County with nearby schools including Byron Elementary School, Byron Middle School, and Peach County High School.
Ownership History
Date
Name
Owned For
Owner Type
Purchase Details
Closed on
Jun 15, 2001
Sold by
Baker Martha A
Bought by
Evans Mark and Rhonda Griggers-Evans
Current Estimated Value
Purchase Details
Closed on
Jun 8, 2001
Sold by
Baker William B
Bought by
Baker Martha A
Purchase Details
Closed on
Mar 21, 1986
Bought by
Baker William B and Baker Martha A
Purchase Details
Closed on
Apr 15, 1983
Bought by
Hoopes Randy G and Hoopes Donna C
Create a Home Valuation Report for This Property
The Home Valuation Report is an in-depth analysis detailing your home's value as well as a comparison with similar homes in the area
Home Values in the Area
Average Home Value in this Area
Purchase History
| Date | Buyer | Sale Price | Title Company |
|---|---|---|---|
| Evans Mark | $96,500 | -- | |
| Baker Martha A | -- | -- | |
| Baker William B | $75,000 | -- | |
| Hoopes Randy G | $63,600 | -- |
Source: Public Records
Tax History
| Year | Tax Paid | Tax Assessment Tax Assessment Total Assessment is a certain percentage of the fair market value that is determined by local assessors to be the total taxable value of land and additions on the property. | Land | Improvement |
|---|---|---|---|---|
| 2025 | $2,456 | $78,920 | $13,280 | $65,640 |
| 2024 | $2,512 | $71,880 | $13,080 | $58,800 |
| 2023 | $2,361 | $67,240 | $7,200 | $60,040 |
| 2022 | $1,550 | $59,560 | $7,200 | $52,360 |
| 2021 | $1,575 | $52,440 | $7,200 | $45,240 |
| 2020 | $1,591 | $52,960 | $7,200 | $45,760 |
| 2019 | $1,599 | $52,960 | $7,200 | $45,760 |
| 2018 | $1,607 | $52,960 | $7,200 | $45,760 |
| 2017 | $1,615 | $52,960 | $7,200 | $45,760 |
| 2016 | $1,608 | $52,960 | $7,200 | $45,760 |
| 2015 | $1,611 | $52,960 | $7,200 | $45,760 |
| 2014 | $1,613 | $52,960 | $7,200 | $45,760 |
| 2013 | -- | $52,960 | $7,200 | $45,760 |
Source: Public Records
Map
Nearby Homes
- 106 Gassett Ct
- 174 Majestic Oak Cir
- 0 W White West Rd
- 126 Early Dr
- 118 Early Dr
- 114 Early Dr
- 123 Early Dr
- 105 Early Dr
- 212 Eric Ct
- 121 Early Dr
- 202 Eric Ct
- 106 Early Dr
- 104 Early Dr
- 113 Early Dr
- 100 Early Dr
- 103 Early Dr
- 208 Eric Ct
- 262 Shantz Way Unit (LOT A48)
- 106 Christopher Dr
- 0 W White Rd Unit 260939
Your Personal Tour Guide
Ask me questions while you tour the home.