239 Shenandoah Farms Rd Blairsville, GA 30512
Estimated Value: $159,000 - $1,972,366
3
Beds
2
Baths
2,296
Sq Ft
$386/Sq Ft
Est. Value
About This Home
This home is located at 239 Shenandoah Farms Rd, Blairsville, GA 30512 and is currently estimated at $885,789, approximately $385 per square foot. 239 Shenandoah Farms Rd is a home located in Union County with nearby schools including Union County Primary School, Union County Elementary School, and Union County Middle School.
Ownership History
Date
Name
Owned For
Owner Type
Purchase Details
Closed on
Feb 24, 2024
Sold by
Jones James Randall
Bought by
Brys Austin
Current Estimated Value
Purchase Details
Closed on
Feb 16, 2024
Sold by
Jones James Randall
Bought by
Jones Melissa and Jones Travis
Purchase Details
Closed on
Aug 24, 2022
Sold by
Jones James Randall
Bought by
Brys Austin
Purchase Details
Closed on
May 30, 2013
Sold by
Jones James R
Bought by
Morgan Joseph and Morgan Myra
Purchase Details
Closed on
May 29, 2009
Sold by
United Community Bank
Bought by
Jones James Randy and Jones Claudi W
Purchase Details
Closed on
Nov 4, 2008
Sold by
Jones James R
Bought by
United Community Bank
Purchase Details
Closed on
Feb 21, 2006
Sold by
Richards Dorothy
Bought by
Atkins Sandra and Atkins Donna
Purchase Details
Closed on
Aug 11, 1983
Bought by
Jones James Randall
Create a Home Valuation Report for This Property
The Home Valuation Report is an in-depth analysis detailing your home's value as well as a comparison with similar homes in the area
Home Values in the Area
Average Home Value in this Area
Purchase History
| Date | Buyer | Sale Price | Title Company |
|---|---|---|---|
| Brys Austin | -- | -- | |
| Jones Melissa | -- | -- | |
| Brys Austin | -- | -- | |
| Morgan Joseph | $27,640 | -- | |
| Jones James Randy | $40,000 | -- | |
| United Community Bank | $108,379 | -- | |
| Atkins Sandra | -- | -- | |
| Jones James Randall | -- | -- |
Source: Public Records
Tax History Compared to Growth
Tax History
| Year | Tax Paid | Tax Assessment Tax Assessment Total Assessment is a certain percentage of the fair market value that is determined by local assessors to be the total taxable value of land and additions on the property. | Land | Improvement |
|---|---|---|---|---|
| 2024 | $5,401 | $687,020 | $263,640 | $423,380 |
| 2023 | $2,178 | $464,076 | $345,360 | $118,716 |
| 2022 | $1,855 | $360,368 | $264,000 | $96,368 |
| 2021 | $1,866 | $340,488 | $264,000 | $76,488 |
| 2020 | $1,345 | $238,391 | $205,409 | $32,982 |
| 2019 | $1,253 | $238,391 | $205,409 | $32,982 |
| 2018 | $4,188 | $238,391 | $205,409 | $32,982 |
| 2017 | $1,196 | $238,391 | $205,409 | $32,982 |
| 2016 | $1,090 | $238,391 | $205,409 | $32,982 |
| 2015 | -- | $238,391 | $205,409 | $32,982 |
| 2013 | -- | $0 | $0 | $0 |
Source: Public Records
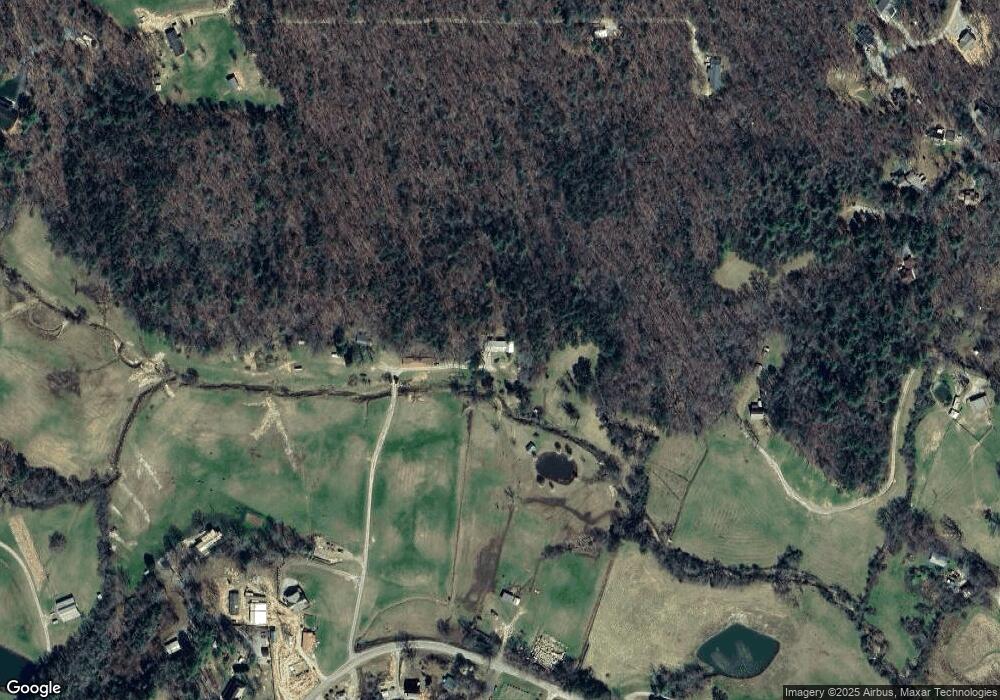
Map
Nearby Homes
- lot 8 Hawks Nest Rd
- LOT 10 Hawks Nest Rd Unit 10
- 10 W Hawks Nest Rd
- Lot 16 Stacy Ln
- Lot 17 Stacy Ln
- 125 Spivey Ridge Rd
- 369 Timber Blossom Dr
- 274 Wild Ridge Rd
- 540 Young Cane Creek Rd
- 001 Harmony Rd
- 18 Dillard Place
- 127 Hard Rock Hill
- TRACT 1 Timber Ridge Rd
- TRACT 2 Timber Ridge Rd
- 411 Deer Haven Dr
- 422 Timber Ridge Rd
- LT 53 Clay Dr
- LOT 48 Laurel Brooke
- 3.52 AC Payne Way
- 8 AC Payne Way
- 181 Shenandoah Farms Rd
- 0 Old Owen Glen Unit 177
- 133 Old Owen Dr
- 0 Old Owen Glen Unit 177 8284392
- 330 Johnson Ln
- 684 Serena Rd
- 1086 Jones Creek Rd
- 8 Old Gainesville Hwy Unit Tract II
- 0 Shenandoah Farms Unit 7603921
- 0 Shenandoah Farms
- 51 Shenandoah Farms Rd
- 957 Jones Creek Rd
- 777 Serena Rd
- 128 Brooke Ln
- 1013 Jones Creek Rd
- 22 Bebber Dr
- 945 Jones Creek Rd
- 1043 Jones Creek Rd
- 27 Old Cane Mill Rd
- 80 Iris Ln