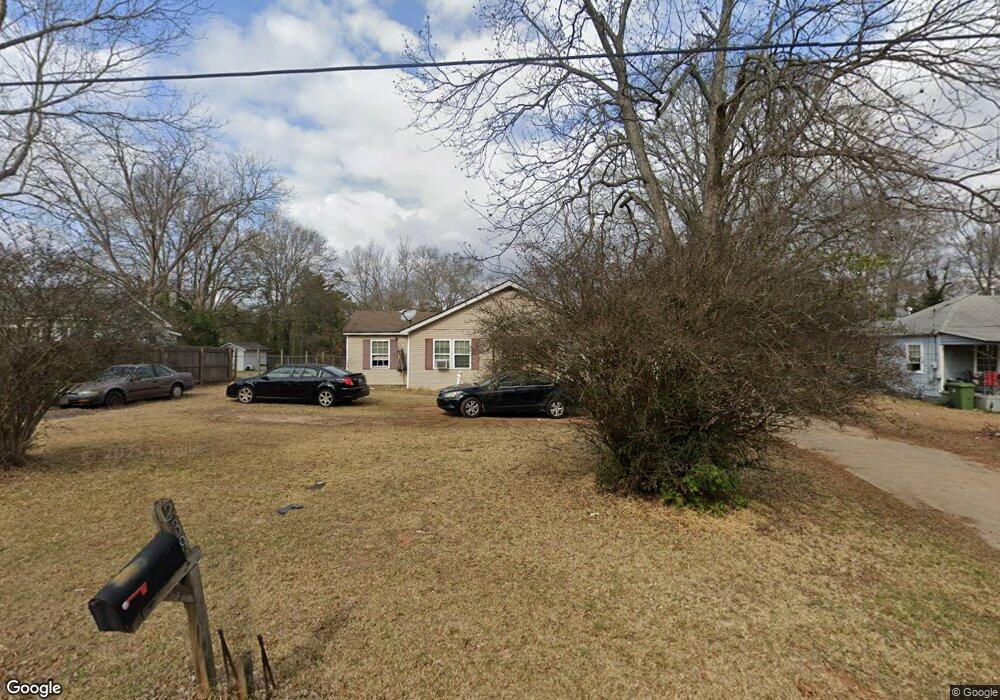
239 Spring St Griffin, GA 30223
Spalding County NeighborhoodEstimated Value: $120,000 - $134,000
3
Beds
1
Bath
852
Sq Ft
$149/Sq Ft
Est. Value
About This Home
This home is located at 239 Spring St, Griffin, GA 30223 and is currently estimated at $127,235, approximately $149 per square foot. 239 Spring St is a home located in Spalding County with nearby schools including Jackson Road Elementary School, Kennedy Road Middle School, and Spalding High School.
Ownership History
Date
Name
Owned For
Owner Type
Purchase Details
Closed on
Mar 31, 2006
Sold by
Holberg Douglas S
Bought by
Washington Clifford J
Current Estimated Value
Home Financials for this Owner
Home Financials are based on the most recent Mortgage that was taken out on this home.
Original Mortgage
$77,500
Outstanding Balance
$44,253
Interest Rate
6.25%
Mortgage Type
New Conventional
Estimated Equity
$82,982
Purchase Details
Closed on
Sep 30, 2005
Sold by
Upland Mtg
Bought by
Hollberg Douglas S
Purchase Details
Closed on
Jun 1, 2005
Sold by
Green Thomas
Bought by
Upland Mtg Mtg
Purchase Details
Closed on
Feb 15, 1974
Sold by
Green G W Estate
Bought by
Green Omega B
Purchase Details
Closed on
Jun 15, 1972
Sold by
Stansell Helen
Bought by
Green G W
Purchase Details
Closed on
Jun 2, 1964
Bought by
Stansell Helen
Create a Home Valuation Report for This Property
The Home Valuation Report is an in-depth analysis detailing your home's value as well as a comparison with similar homes in the area
Home Values in the Area
Average Home Value in this Area
Purchase History
| Date | Buyer | Sale Price | Title Company |
|---|---|---|---|
| Washington Clifford J | $77,500 | -- | |
| Hollberg Douglas S | $16,000 | -- | |
| Upland Mtg Mtg | $42,000 | -- | |
| Green Omega B | $12,000 | -- | |
| Green G W | $10,800 | -- | |
| Stansell Helen | $8,800 | -- |
Source: Public Records
Mortgage History
| Date | Status | Borrower | Loan Amount |
|---|---|---|---|
| Open | Washington Clifford J | $77,500 |
Source: Public Records
Tax History Compared to Growth
Tax History
| Year | Tax Paid | Tax Assessment Tax Assessment Total Assessment is a certain percentage of the fair market value that is determined by local assessors to be the total taxable value of land and additions on the property. | Land | Improvement |
|---|---|---|---|---|
| 2024 | $578 | $34,928 | $5,000 | $29,928 |
| 2023 | $578 | $23,786 | $5,120 | $18,666 |
| 2022 | $272 | $19,722 | $3,200 | $16,522 |
| 2021 | $191 | $16,248 | $3,200 | $13,048 |
| 2020 | $155 | $14,377 | $3,200 | $11,177 |
| 2019 | $468 | $14,377 | $3,200 | $11,177 |
| 2018 | $464 | $13,959 | $3,200 | $10,759 |
| 2017 | $452 | $13,959 | $3,200 | $10,759 |
| 2016 | $460 | $13,959 | $3,200 | $10,759 |
| 2015 | $474 | $13,959 | $3,200 | $10,759 |
| 2014 | $484 | $13,959 | $3,200 | $10,759 |
Source: Public Records
Map
Nearby Homes
- 251 Lang St
- 132 Lang St
- 911 Clayton St
- 917 E Broadway St
- 170 Jackson Ln
- 108 Jackson Ln
- 406 Pinelea Rd
- 1029 High Falls Rd
- 320 Morris St
- 1765 High Falls Rd
- 512 Searcy Ave
- 303 E Broadway St
- 715 E Chappell St
- 203 N 1st St
- 588 Elles Way
- 127 Kennedy Rd
- 234 N 2nd St
- 523 E Chappell St
- 8 RENTALS HOUSE 712 Searcy Ave
- 602 Circus St