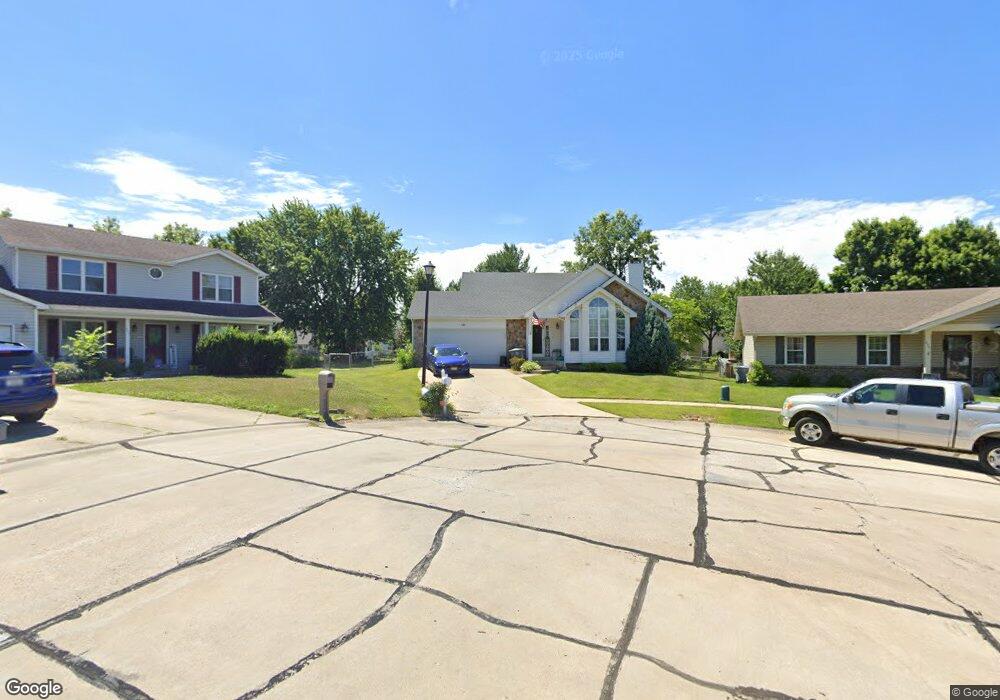
239 Surrey Ct O Fallon, MO 63366
Estimated Value: $327,278 - $367,000
3
Beds
2
Baths
1,448
Sq Ft
$240/Sq Ft
Est. Value
About This Home
This home is located at 239 Surrey Ct, O Fallon, MO 63366 and is currently estimated at $348,070, approximately $240 per square foot. 239 Surrey Ct is a home located in St. Charles County with nearby schools including Joseph L. Mudd Elementary School, Forest Park Elementary School, and Fort Zumwalt North Middle School.
Ownership History
Date
Name
Owned For
Owner Type
Purchase Details
Closed on
May 27, 2015
Sold by
Kkbp Llc
Bought by
Rascher Michael and Rascher Elizabeth
Current Estimated Value
Home Financials for this Owner
Home Financials are based on the most recent Mortgage that was taken out on this home.
Original Mortgage
$176,641
Outstanding Balance
$133,983
Interest Rate
3.5%
Mortgage Type
FHA
Estimated Equity
$214,087
Purchase Details
Closed on
Jul 17, 2012
Sold by
Livi Prinster Kent A and Livi Kent A Prinster Revocable
Bought by
Kkbp Llc
Purchase Details
Closed on
Sep 12, 2005
Sold by
Prinster Kent A and Prinster Kimberly F
Bought by
Prinster Kent A and Kent A Prinster Revocable Trus
Purchase Details
Closed on
Nov 15, 1998
Sold by
Prinster Kent A Kimberly F
Bought by
Prinster Bradley R
Create a Home Valuation Report for This Property
The Home Valuation Report is an in-depth analysis detailing your home's value as well as a comparison with similar homes in the area
Home Values in the Area
Average Home Value in this Area
Purchase History
We collect this data history from publicly available records. To have your information removed, we recommend requesting removal directly through your county’s website.
| Date | Buyer | Sale Price | Title Company |
|---|---|---|---|
| Rascher Michael | $179,900 | None Available | |
| Kkbp Llc | -- | Assured Title Company | |
| Prinster Kent A | -- | None Available | |
| Prinster Bradley R | -- | -- |
Source: Public Records
Mortgage History
We collect this data history from publicly available records. To have your information removed, we recommend requesting removal directly through your county’s website.
| Date | Status | Borrower | Loan Amount |
|---|---|---|---|
| Open | Rascher Michael | $176,641 |
Source: Public Records
Tax History
| Year | Tax Paid | Tax Assessment Tax Assessment Total Assessment is a certain percentage of the fair market value that is determined by local assessors to be the total taxable value of land and additions on the property. | Land | Improvement |
|---|---|---|---|---|
| 2025 | $3,304 | $54,542 | -- | -- |
| 2023 | $3,306 | $49,851 | $0 | $0 |
| 2022 | $3,100 | $43,489 | $0 | $0 |
| 2021 | $3,103 | $43,489 | $0 | $0 |
| 2020 | $2,812 | $38,179 | $0 | $0 |
| 2019 | $2,793 | $37,831 | $0 | $0 |
| 2018 | $2,583 | $33,376 | $0 | $0 |
| 2017 | $2,546 | $33,376 | $0 | $0 |
| 2016 | $2,397 | $31,300 | $0 | $0 |
| 2015 | $2,229 | $31,300 | $0 | $0 |
| 2014 | $2,149 | $29,687 | $0 | $0 |
Source: Public Records
Map
Nearby Homes
- 328 Bristol Place
- 415 Montbrook Dr
- 539 Galway Dr Unit 6B
- 727 Cordes St
- 0 Montbrook Dr
- 714 Cordes St
- 232 Sunset Villa Cir
- 50 Chip Dr
- 2 Poe Ct
- 807 Elaine Dr
- 710 Longfellow Cir
- 512 Sonderen St
- 105 Saint Margaret Ln
- 906 Daffodil Ridge Dr
- 886 Sherwood Forest Ct
- 202 Sword Lily Dr
- 319 Magnolia Valley Dr
- 846 Molloy Dr
- 413 Prince David Dr
- 1100 Cypress Point Dr
- 305 Surrey Ct
- 243 Surrey Ct
- 235 Surrey Ct
- 314 Bristol Place
- 310 Bristol Place
- 318 Bristol Place
- 324 Bristol Place
- 306 Bristol Place
- 231 Surrey Ct
- 332 Bristol Place
- 242 Surrey Ct
- 338 Bristol Place
- 302 Bristol Place
- 325 Birmingham Dr
- 329 Birmingham Dr
- 321 Birmingham Dr
- 238 Surrey Ct
- 333 Birmingham Dr
- 0TBB Bristol II
- 0TBB Bristol
Your Personal Tour Guide
Ask me questions while you tour the home.