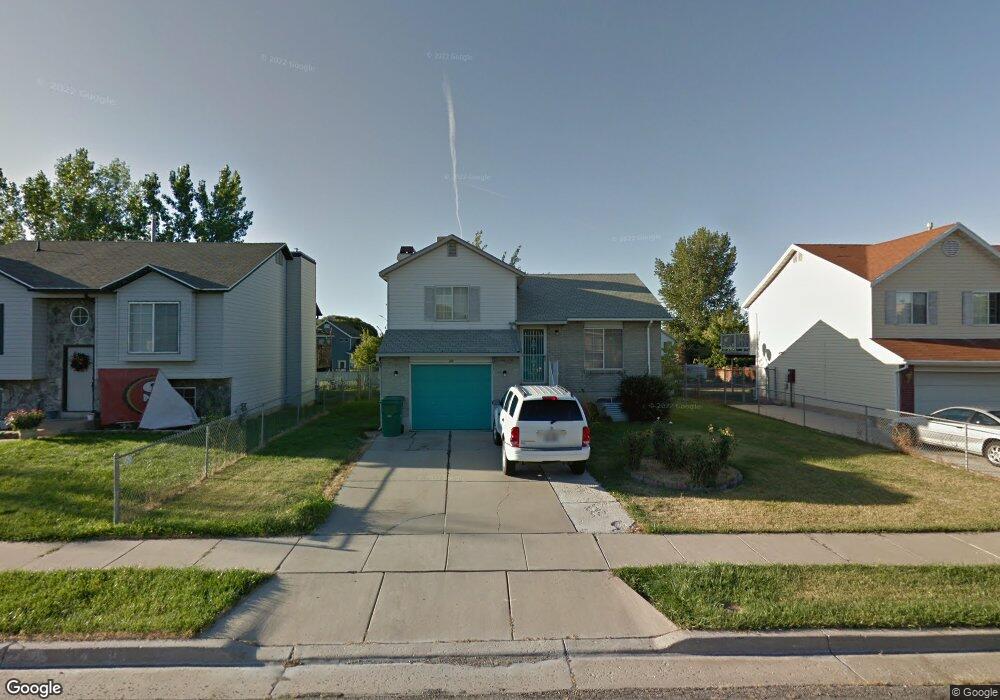
239 W 1650 N Layton, UT 84041
Estimated Value: $432,000 - $455,000
3
Beds
2
Baths
1,604
Sq Ft
$275/Sq Ft
Est. Value
About This Home
This home is located at 239 W 1650 N, Layton, UT 84041 and is currently estimated at $441,560, approximately $275 per square foot. 239 W 1650 N is a home located in Davis County with nearby schools including Lincoln Elementary School, North Layton Junior High School, and Northridge High School.
Ownership History
Date
Name
Owned For
Owner Type
Purchase Details
Closed on
Nov 1, 2023
Sold by
Merciian Claudia L
Bought by
Merchan Family Trust and Merciian
Current Estimated Value
Purchase Details
Closed on
Apr 7, 2021
Sold by
Pino Christopher S
Bought by
Merchan Claudia L
Purchase Details
Closed on
Jun 30, 2014
Sold by
Pautin Enrique A and Pautin Josefina L
Bought by
Pino Christopher S
Purchase Details
Closed on
Jul 23, 1997
Sold by
Pautin Enrique Ancheta and Pautin Josefina L
Bought by
Pautin Enrique A and Pautin Josefina L
Home Financials for this Owner
Home Financials are based on the most recent Mortgage that was taken out on this home.
Original Mortgage
$102,306
Interest Rate
7.12%
Mortgage Type
FHA
Create a Home Valuation Report for This Property
The Home Valuation Report is an in-depth analysis detailing your home's value as well as a comparison with similar homes in the area
Home Values in the Area
Average Home Value in this Area
Purchase History
| Date | Buyer | Sale Price | Title Company |
|---|---|---|---|
| Merchan Family Trust | -- | None Listed On Document | |
| Merchan Claudia L | -- | Us Title Company O | |
| Pino Christopher S | -- | Cornerstone Title Ins Agen | |
| Pautin Enrique A | -- | First American Title Co |
Source: Public Records
Mortgage History
| Date | Status | Borrower | Loan Amount |
|---|---|---|---|
| Previous Owner | Pautin Enrique A | $102,306 |
Source: Public Records
Tax History
| Year | Tax Paid | Tax Assessment Tax Assessment Total Assessment is a certain percentage of the fair market value that is determined by local assessors to be the total taxable value of land and additions on the property. | Land | Improvement |
|---|---|---|---|---|
| 2025 | $2,164 | $227,150 | $101,792 | $125,358 |
| 2024 | $2,075 | $219,449 | $118,919 | $100,530 |
| 2023 | $2,039 | $209,000 | $75,588 | $133,411 |
| 2022 | $2,103 | $387,000 | $130,598 | $256,402 |
| 2021 | $1,802 | $272,000 | $98,582 | $173,418 |
| 2020 | $1,623 | $235,000 | $83,859 | $151,141 |
| 2019 | $1,593 | $226,000 | $80,484 | $145,516 |
| 2018 | $1,433 | $204,000 | $80,484 | $123,516 |
| 2016 | $1,218 | $89,485 | $25,122 | $64,363 |
| 2015 | $1,164 | $81,180 | $25,122 | $56,058 |
| 2014 | $1,171 | $83,472 | $25,122 | $58,350 |
| 2013 | -- | $88,494 | $25,325 | $63,169 |
Source: Public Records
Map
Nearby Homes
Your Personal Tour Guide
Ask me questions while you tour the home.