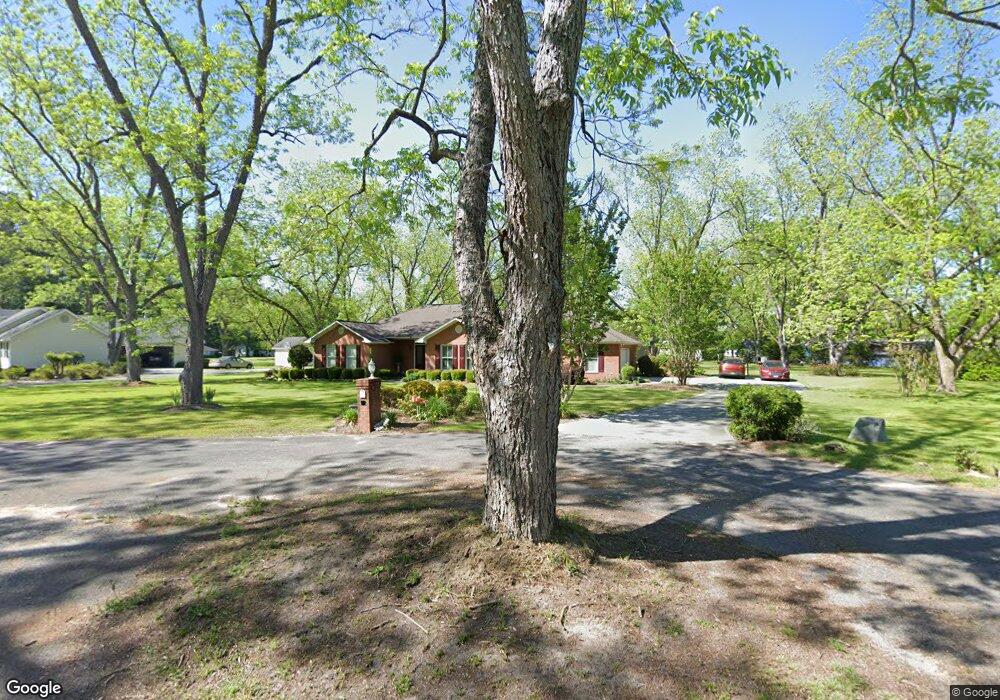
239 Wells Orchard Dublin, GA 31021
Estimated Value: $263,000 - $342,000
4
Beds
2
Baths
2,795
Sq Ft
$112/Sq Ft
Est. Value
About This Home
This home is located at 239 Wells Orchard, Dublin, GA 31021 and is currently estimated at $312,658, approximately $111 per square foot. 239 Wells Orchard is a home located in Laurens County with nearby schools including Northwest Laurens Elementary School, Southwest Laurens Elementary School, and East Laurens Primary School.
Ownership History
Date
Name
Owned For
Owner Type
Purchase Details
Closed on
Feb 11, 2011
Sold by
L M Curry Jr Family Lllp
Bought by
Mcclain Arthur B and Mcclain Sallie B
Current Estimated Value
Purchase Details
Closed on
Apr 9, 2010
Sold by
Moore Station Development Co Llc
Bought by
L M Curry Jr Family Lllp
Purchase Details
Closed on
Jun 14, 2005
Sold by
Durden George F
Bought by
Combs Jeffrey
Home Financials for this Owner
Home Financials are based on the most recent Mortgage that was taken out on this home.
Original Mortgage
$209,000
Interest Rate
5.5%
Mortgage Type
New Conventional
Purchase Details
Closed on
Jun 30, 1996
Sold by
Mayo Brent A and Mayo Patri
Bought by
Durden George F and Durden Ja
Purchase Details
Closed on
Jul 19, 1993
Sold by
Clark Clark H and Clark S
Create a Home Valuation Report for This Property
The Home Valuation Report is an in-depth analysis detailing your home's value as well as a comparison with similar homes in the area
Home Values in the Area
Average Home Value in this Area
Purchase History
| Date | Buyer | Sale Price | Title Company |
|---|---|---|---|
| Mcclain Arthur B | $225,000 | -- | |
| L M Curry Jr Family Lllp | $190,000 | -- | |
| Moore Station Development Co Llc | $211,500 | -- | |
| Combs Jeffrey | $220,000 | -- | |
| Durden George F | $155,000 | -- | |
| -- | $14,000 | -- |
Source: Public Records
Mortgage History
| Date | Status | Borrower | Loan Amount |
|---|---|---|---|
| Previous Owner | Combs Jeffrey | $209,000 |
Source: Public Records
Tax History Compared to Growth
Tax History
| Year | Tax Paid | Tax Assessment Tax Assessment Total Assessment is a certain percentage of the fair market value that is determined by local assessors to be the total taxable value of land and additions on the property. | Land | Improvement |
|---|---|---|---|---|
| 2024 | $2,029 | $96,388 | $7,400 | $88,988 |
| 2023 | $1,883 | $88,664 | $7,400 | $81,264 |
| 2022 | $1,883 | $88,664 | $7,400 | $81,264 |
| 2021 | $1,723 | $79,047 | $7,200 | $71,847 |
| 2020 | $1,725 | $79,047 | $7,200 | $71,847 |
| 2019 | $1,727 | $79,047 | $7,200 | $71,847 |
| 2018 | $1,729 | $79,047 | $7,200 | $71,847 |
| 2017 | $1,727 | $79,047 | $7,200 | $71,847 |
| 2016 | $1,729 | $79,047 | $7,200 | $71,847 |
| 2015 | $1,730 | $79,047 | $7,200 | $71,847 |
| 2014 | $1,655 | $73,816 | $7,000 | $66,816 |
Source: Public Records
Map
Nearby Homes
- 256 Wells Cir
- 415 Willa Ln
- 1400 Peach St
- 209 Plum St
- 105 Palisade Dr
- 108 Plum St
- 305 Lassiter Dr
- 209 Rollingwood Dr
- 211 Palisade Dr
- 121 Rollingwood Dr
- 106 Country Club Rd
- 201 Lancelot Ln
- 307 Lancelot Ln
- 113 Camelot Dr
- 446 Willow Point Dr
- 313 Shadow Pond
- 157 Lakeview Ln
- 912 Sussex Ct
- 531 Brookdale Dr
- 237 Wells Orchard
- 241 Wells Orchard
- 247 Wells Cir
- 114 Perry Dairy Rd
- 120 Perry Dairy Rd
- 235 Wells Orchard
- 233 Wells Orchard
- 231 Wells Orchard
- 124 Perry Dairy Rd
- 450 Country Club Rd
- 454 Country Club Rd
- 446 Country Club Rd
- 440 Country Club Rd
- 115 Perry Dairy Rd
- 253 Wells Cir
- 111 Perry Dairy Rd
- 246 Wells Cir
- 232 Wells Cir
- 127 Perry Dairy Rd
- 252 Wells Cir