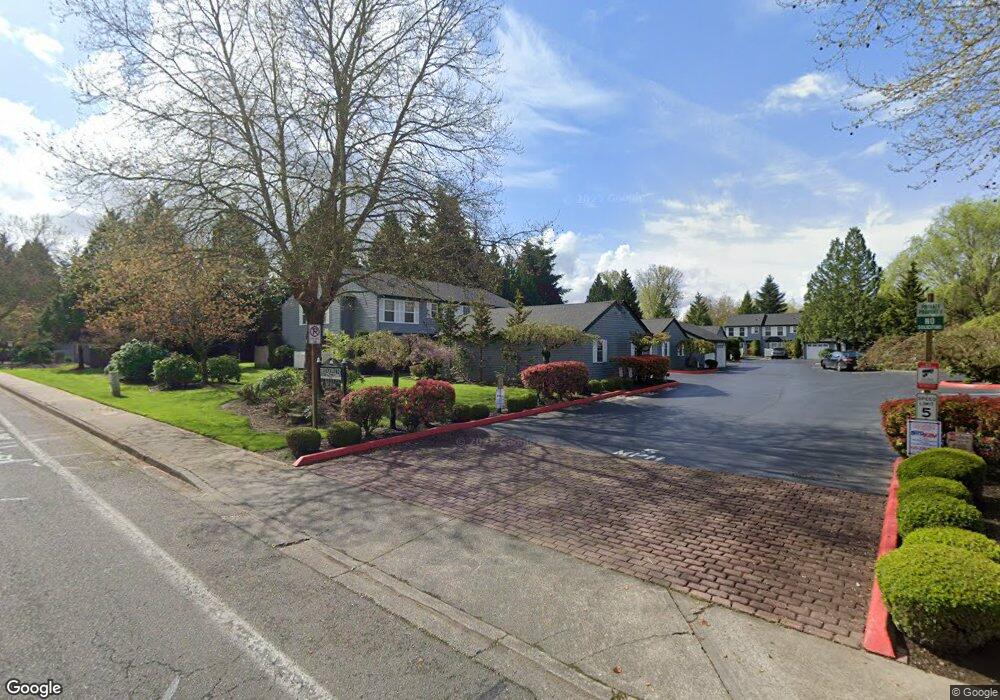
23906 56th Ct S Unit 3C5 Kent, WA 98032
The Lakes NeighborhoodEstimated Value: $413,000 - $446,000
2
Beds
2
Baths
1,131
Sq Ft
$379/Sq Ft
Est. Value
About This Home
This home is located at 23906 56th Ct S Unit 3C5, Kent, WA 98032 and is currently estimated at $428,659, approximately $379 per square foot. 23906 56th Ct S Unit 3C5 is a home located in King County with nearby schools including Neely O Brien Elementary School, Mill Creek Middle School, and Kent-Meridian High School.
Ownership History
Date
Name
Owned For
Owner Type
Purchase Details
Closed on
Mar 23, 2015
Sold by
Bridgewater
Bought by
City Of Kent
Current Estimated Value
Purchase Details
Closed on
Oct 10, 2014
Sold by
Kuhlman Candis L
Bought by
Craig Joseph T and Craig Cynthia A
Home Financials for this Owner
Home Financials are based on the most recent Mortgage that was taken out on this home.
Original Mortgage
$141,000
Interest Rate
4.08%
Purchase Details
Closed on
Oct 27, 2003
Sold by
Gower Nancy L
Bought by
Kuhlman Candis L
Home Financials for this Owner
Home Financials are based on the most recent Mortgage that was taken out on this home.
Original Mortgage
$110,000
Interest Rate
5.98%
Purchase Details
Closed on
May 25, 1990
Sold by
Schneider Homes Inc
Bought by
Gower Nancy L
Create a Home Valuation Report for This Property
The Home Valuation Report is an in-depth analysis detailing your home's value as well as a comparison with similar homes in the area
Home Values in the Area
Average Home Value in this Area
Purchase History
| Date | Buyer | Sale Price | Title Company |
|---|---|---|---|
| City Of Kent | -- | Accommodation | |
| Craig Joseph T | $194,045 | First American | |
| Kuhlman Candis L | $162,500 | Commonwealth L | |
| Gower Nancy L | $95,600 | -- |
Source: Public Records
Mortgage History
| Date | Status | Borrower | Loan Amount |
|---|---|---|---|
| Previous Owner | Craig Joseph T | $141,000 | |
| Previous Owner | Kuhlman Candis L | $110,000 |
Source: Public Records
Tax History Compared to Growth
Tax History
| Year | Tax Paid | Tax Assessment Tax Assessment Total Assessment is a certain percentage of the fair market value that is determined by local assessors to be the total taxable value of land and additions on the property. | Land | Improvement |
|---|---|---|---|---|
| 2024 | $4,151 | $398,000 | $54,100 | $343,900 |
| 2023 | $4,638 | $432,000 | $51,500 | $380,500 |
| 2022 | $3,936 | $388,000 | $51,500 | $336,500 |
| 2021 | $3,848 | $329,000 | $48,900 | $280,100 |
| 2020 | $3,571 | $307,000 | $48,900 | $258,100 |
| 2018 | $3,061 | $245,000 | $46,400 | $198,600 |
| 2017 | $2,831 | $229,000 | $46,200 | $182,800 |
| 2016 | $2,479 | $216,000 | $46,200 | $169,800 |
| 2015 | $2,752 | $178,000 | $46,200 | $131,800 |
| 2014 | -- | $195,000 | $46,200 | $148,800 |
| 2013 | -- | $130,000 | $46,200 | $83,800 |
Source: Public Records
Map
Nearby Homes
- 5509 S 237th Place Unit 12-3
- 23955 58th Ct S Unit E1
- 5736 S 238th Ct Unit E4
- 23959 58th Ct S Unit C-1
- 5409 S 237th Place Unit 16-4
- 23606 55th Ave S Unit 11-03
- 5403 S 236th St Unit 2
- 5319 S 236th St Unit 6
- 23512 55th Ave S Unit 16
- 23420 54th Ave S Unit 25-1
- 5812 S 234th St
- 23331 59th Place S Unit 16-4
- 23425 51st Ave S
- 23402 62nd Ave S
- 23228 59th Ct S
- 1611 W Smith Ct Unit 11
- 4931 S 233rd Place Unit 27-1
- 6711 S 239th Place Unit A104
- 23907 67th Place S Unit C102
- 1313 W James St Unit 9
- 23906 56th Ct S Unit A2
- 23906 56th Ct S Unit A3
- 23906 56th Ct S Unit 4D2
- 23906 56th Ct S Unit 6F5
- 23906 56th Ct S Unit 2B4
- 23906 56th Ct S Unit 2B2
- 23906 56th Ct S Unit 4D1
- 23906 56th Ct S Unit 6F4
- 23906 56th Ct S Unit 6F3
- 23906 56th Ct S Unit 6F2
- 23906 56th Ct S Unit 6F1
- 23906 56th Ct S Unit 5E4
- 23906 56th Ct S Unit 5E3
- 23906 56th Ct S Unit 5E2
- 23906 56th Ct S Unit 5E1
- 23906 56th Ct S Unit 4D4
- 23906 56th Ct S Unit 4D3
- 23906 56th Ct S Unit 2B3
- 23906 56th Ct S Unit 3C4
- 23906 56th Ct S Unit 3C3