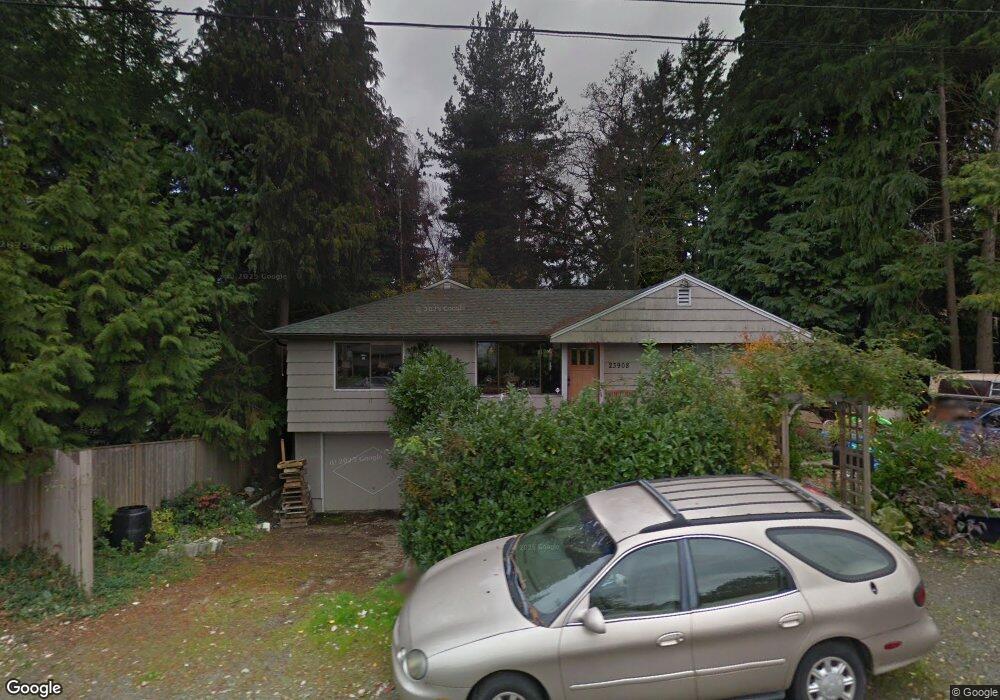
23908 60th Ave W Mountlake Terrace, WA 98043
Gateway NeighborhoodEstimated Value: $735,000 - $850,697
5
Beds
2
Baths
2,198
Sq Ft
$368/Sq Ft
Est. Value
About This Home
This home is located at 23908 60th Ave W, Mountlake Terrace, WA 98043 and is currently estimated at $808,424, approximately $367 per square foot. 23908 60th Ave W is a home located in Snohomish County with nearby schools including Mountlake Terrace Elementary School, Brier Terrace Middle School, and Mountlake Terrace High School.
Ownership History
Date
Name
Owned For
Owner Type
Purchase Details
Closed on
Jun 27, 2018
Sold by
Puchar Kerrie Lin and Puchar William Brian
Bought by
Campion Kate and Campion James
Current Estimated Value
Home Financials for this Owner
Home Financials are based on the most recent Mortgage that was taken out on this home.
Original Mortgage
$536,750
Outstanding Balance
$466,202
Interest Rate
4.6%
Mortgage Type
New Conventional
Estimated Equity
$342,222
Purchase Details
Closed on
Oct 8, 2016
Sold by
Mantei Kerrie Lin
Bought by
Puchar Kerrie Lin and Puchar William Brian
Purchase Details
Closed on
Aug 27, 2014
Sold by
Gamble Joel P
Bought by
Mantel Kerrie L and Gamble Kerrie L
Purchase Details
Closed on
Dec 13, 2005
Sold by
Sutton Michael W and Sutton Kathi J
Bought by
Gamble Joel P and Gamble Kerrie L
Home Financials for this Owner
Home Financials are based on the most recent Mortgage that was taken out on this home.
Original Mortgage
$230,625
Interest Rate
6.37%
Mortgage Type
Fannie Mae Freddie Mac
Create a Home Valuation Report for This Property
The Home Valuation Report is an in-depth analysis detailing your home's value as well as a comparison with similar homes in the area
Home Values in the Area
Average Home Value in this Area
Purchase History
| Date | Buyer | Sale Price | Title Company |
|---|---|---|---|
| Campion Kate | $565,000 | Rainier Title Llc | |
| Puchar Kerrie Lin | -- | None Available | |
| Mantel Kerrie L | -- | None Available | |
| Gamble Joel P | $307,500 | Pnwt |
Source: Public Records
Mortgage History
| Date | Status | Borrower | Loan Amount |
|---|---|---|---|
| Open | Campion Kate | $536,750 | |
| Previous Owner | Gamble Joel P | $230,625 |
Source: Public Records
Tax History Compared to Growth
Tax History
| Year | Tax Paid | Tax Assessment Tax Assessment Total Assessment is a certain percentage of the fair market value that is determined by local assessors to be the total taxable value of land and additions on the property. | Land | Improvement |
|---|---|---|---|---|
| 2025 | $5,803 | $718,700 | $428,300 | $290,400 |
| 2024 | $5,803 | $719,600 | $429,200 | $290,400 |
| 2023 | $5,336 | $745,900 | $453,700 | $292,200 |
| 2022 | $5,095 | $585,700 | $339,500 | $246,200 |
| 2020 | $4,810 | $487,700 | $276,500 | $211,200 |
| 2019 | $3,757 | $382,900 | $256,100 | $126,800 |
| 2018 | $3,739 | $331,800 | $218,300 | $113,500 |
| 2017 | $3,044 | $284,600 | $184,300 | $100,300 |
| 2016 | $2,668 | $259,200 | $163,000 | $96,200 |
| 2015 | $2,481 | $226,100 | $139,700 | $86,400 |
| 2013 | $2,198 | $190,100 | $100,400 | $89,700 |
Source: Public Records
Map
Nearby Homes
- 23809 60th Ave W
- 23901 59th Place W
- 23806 56th Ave W Unit B
- 5502 240th St SW Unit C304
- 5410 240th St SW
- 24222 54th Ave W Unit 27
- 24222 54th Ave W Unit 19
- 20301 19th Ave NE Unit 1101
- 20318 19th Ave NE
- 20101 14th Ave NE Unit 1
- 24212 52nd Ave W
- 5106 241st St SW
- 19726 Forest Park Dr NE
- 23502 Peterson Dr
- 4902 241st St SW
- 23003 58th Ave W Unit D
- 2531 NE 204th St
- 2224 NE 197th Place
- 4908 236th St SW
- 19855 25th Ave NE Unit 111
- 23906 60th Ave W
- 23904 60th Ave W
- 23911 60th Ave W
- 23909 60th Ave W
- 23913 60th Ave W
- 23907 60th Ave W
- 24001 60th Ave W
- 23902 60th Ave W
- 23905 60th Ave W
- 23910 59th Place W
- 23908 59th Place W
- 5905 241st St SW
- 23903 60th Ave W
- 24000 59th Place W
- 23900 60th Ave W
- 23906 59th Place W
- 24002 59th Place W
- 23904 59th Place W
- 23810 60th Ave W