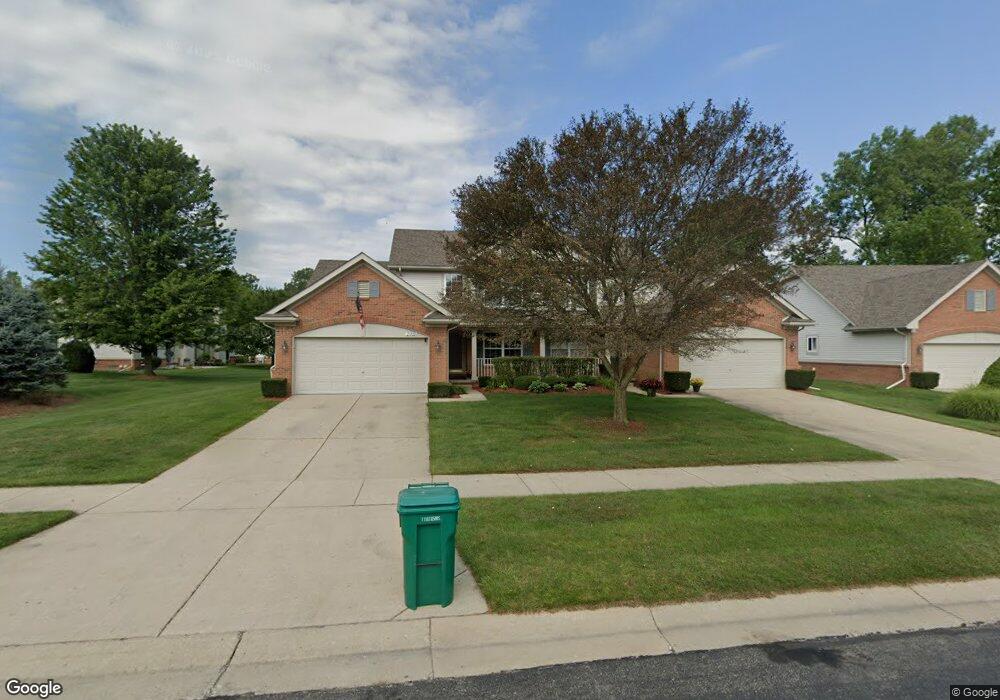
23920 N Park Dr Unit Bldg-Unit New Boston, MI 48164
Estimated Value: $265,426 - $308,000
--
Bed
3
Baths
1,461
Sq Ft
$199/Sq Ft
Est. Value
About This Home
This home is located at 23920 N Park Dr Unit Bldg-Unit, New Boston, MI 48164 and is currently estimated at $290,107, approximately $198 per square foot. 23920 N Park Dr Unit Bldg-Unit is a home located in Wayne County with nearby schools including Huron High School, Summit Academy North Elementary School, and Summit Academy North Middle School.
Ownership History
Date
Name
Owned For
Owner Type
Purchase Details
Closed on
Jan 22, 2021
Sold by
Mathis Donna
Bought by
Russow Brendan
Current Estimated Value
Purchase Details
Closed on
Aug 24, 2018
Sold by
Sparks Patricia
Bought by
Mathis Donna M
Purchase Details
Closed on
Nov 8, 2013
Sold by
Dickinson Amy
Bought by
Dickinson Amy and Sparks Patricia I
Purchase Details
Closed on
Jul 14, 2008
Sold by
Wells Fargo Bank Na
Bought by
Dickinson Amy
Home Financials for this Owner
Home Financials are based on the most recent Mortgage that was taken out on this home.
Original Mortgage
$87,750
Interest Rate
6.57%
Mortgage Type
New Conventional
Purchase Details
Closed on
Aug 22, 2007
Sold by
Irodenko Nadine
Bought by
Wells Fargo Bank Na and Abfc 2004 Opt 4 Trust Abfc Asset Backed
Create a Home Valuation Report for This Property
The Home Valuation Report is an in-depth analysis detailing your home's value as well as a comparison with similar homes in the area
Home Values in the Area
Average Home Value in this Area
Purchase History
| Date | Buyer | Sale Price | Title Company |
|---|---|---|---|
| Russow Brendan | $195,000 | Lawyers Title Agcy Of Monroe | |
| Mathis Donna M | -- | Michigan Title Ins Agency In | |
| Dickinson Amy | -- | None Available | |
| Dickinson Amy | $97,500 | Attorneys Title Agency Inc | |
| Wells Fargo Bank Na | $127,500 | None Available |
Source: Public Records
Mortgage History
| Date | Status | Borrower | Loan Amount |
|---|---|---|---|
| Previous Owner | Dickinson Amy | $87,750 |
Source: Public Records
Tax History Compared to Growth
Tax History
| Year | Tax Paid | Tax Assessment Tax Assessment Total Assessment is a certain percentage of the fair market value that is determined by local assessors to be the total taxable value of land and additions on the property. | Land | Improvement |
|---|---|---|---|---|
| 2025 | $2,562 | $127,100 | $0 | $0 |
| 2024 | $2,562 | $120,500 | $0 | $0 |
| 2023 | $2,443 | $109,700 | $0 | $0 |
| 2022 | $4,446 | $107,400 | $0 | $0 |
| 2021 | $3,983 | $98,700 | $0 | $0 |
| 2020 | $3,908 | $95,400 | $0 | $0 |
| 2019 | $3,727 | $92,200 | $0 | $0 |
| 2018 | $1,529 | $91,800 | $0 | $0 |
| 2017 | $2,540 | $87,800 | $0 | $0 |
| 2016 | $2,768 | $87,800 | $0 | $0 |
| 2015 | $6,627 | $79,800 | $0 | $0 |
| 2013 | $6,420 | $64,200 | $0 | $0 |
| 2012 | -- | $62,900 | $13,300 | $49,600 |
Source: Public Records
Map
Nearby Homes
- 30826 Lower Ridge Dr Unit 96
- 23565 Crescent Ridge Dr
- 23594 Crescent Ridge Dr
- 29581 Trail Creek Dr
- 23309 N Park Dr Unit 61
- 23313 Crescent Ridge Dr Unit 59
- 23150 Waterview Dr
- 23196 W Creek Dr
- 30753 West Rd
- 25430 Bohn Ct Unit 23
- 25407 Willowbrook Ct Unit 4
- 22293 Georgia Pine Dr
- 31612 Beaver Cir
- 31614 Beaver Cir
- 25618 Middlebelt Rd
- 000 West Rd
- 21435 Merriman Rd
- 24487 Dugan Dr
- 27520 West Rd
- 24433 Dugan Dr
- 23920 N Park Dr Unit 32
- 23918 N Park Dr
- 29900 Trail Creek Dr Unit 33
- 30064 Trail Creek Dr Unit 35
- 23929 N Park Dr
- 23866 N Park Dr
- 23864 N Park Dr
- 30066 Trail Creek Dr Unit 36
- 23931 N Park Dr
- 23867 N Park Dr Unit 47
- 23865 N Park Dr
- 23973 N Park Dr
- 23975 N Park Dr
- 23975 N Park Dr Unit 43
- 23812 N Park Dr
- 30228 Trail Creek Dr Unit 37
- 30230 Trail Creek Dr
- 23793 N Park Dr Unit 49
- 23810 N Park Dr
- 30392 Trail Creek Dr