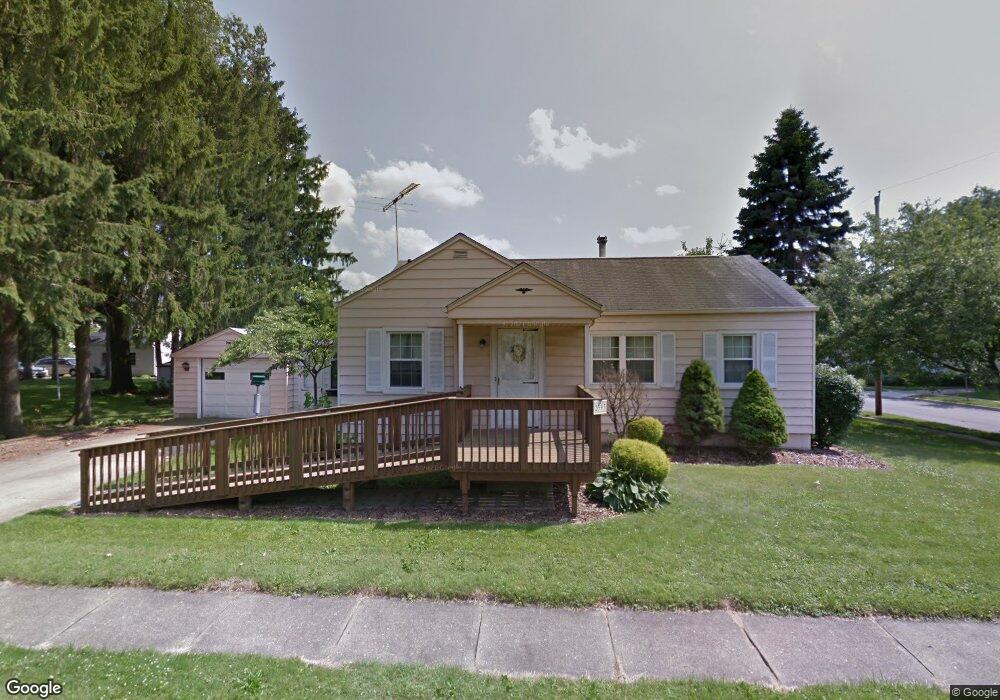
2393 11th St Cuyahoga Falls, OH 44221
Phelps Avenue NeighborhoodEstimated Value: $123,000 - $182,000
3
Beds
2
Baths
996
Sq Ft
$163/Sq Ft
Est. Value
About This Home
This home is located at 2393 11th St, Cuyahoga Falls, OH 44221 and is currently estimated at $162,122, approximately $162 per square foot. 2393 11th St is a home located in Summit County with nearby schools including Dewitt Elementary School, Bolich Middle School, and Cuyahoga Falls High School.
Ownership History
Date
Name
Owned For
Owner Type
Purchase Details
Closed on
Dec 16, 2023
Sold by
Himelright Gay L
Bought by
Buy Right Real Estate Llc
Current Estimated Value
Home Financials for this Owner
Home Financials are based on the most recent Mortgage that was taken out on this home.
Original Mortgage
$110,000
Outstanding Balance
$108,263
Interest Rate
7.76%
Mortgage Type
Seller Take Back
Estimated Equity
$53,859
Purchase Details
Closed on
Feb 6, 2021
Sold by
Himeright Justin W
Bought by
Himeiright Gay L
Purchase Details
Closed on
Apr 25, 2013
Sold by
Himelright Justin W and Himelright Gay L
Bought by
Himelright Justin W and Himelright Gay L
Purchase Details
Closed on
Apr 24, 2013
Sold by
Vaughn Josephine E
Bought by
Himelright Justin W
Create a Home Valuation Report for This Property
The Home Valuation Report is an in-depth analysis detailing your home's value as well as a comparison with similar homes in the area
Home Values in the Area
Average Home Value in this Area
Purchase History
| Date | Buyer | Sale Price | Title Company |
|---|---|---|---|
| Buy Right Real Estate Llc | $110,000 | Nova Title | |
| Himeiright Gay L | -- | None Available | |
| Himelright Justin W | -- | None Available | |
| Himelright Justin W | $40,500 | None Available |
Source: Public Records
Mortgage History
| Date | Status | Borrower | Loan Amount |
|---|---|---|---|
| Open | Buy Right Real Estate Llc | $110,000 |
Source: Public Records
Tax History Compared to Growth
Tax History
| Year | Tax Paid | Tax Assessment Tax Assessment Total Assessment is a certain percentage of the fair market value that is determined by local assessors to be the total taxable value of land and additions on the property. | Land | Improvement |
|---|---|---|---|---|
| 2025 | $2,978 | $53,929 | $12,527 | $41,402 |
| 2024 | $2,978 | $53,929 | $12,527 | $41,402 |
| 2023 | $2,978 | $53,929 | $12,527 | $41,402 |
| 2022 | $2,562 | $37,713 | $8,761 | $28,952 |
| 2021 | $2,562 | $37,713 | $8,761 | $28,952 |
| 2020 | $2,521 | $37,710 | $8,760 | $28,950 |
| 2019 | $2,570 | $35,020 | $8,720 | $26,300 |
| 2018 | $2,191 | $35,020 | $8,720 | $26,300 |
| 2017 | $2,166 | $35,020 | $8,720 | $26,300 |
| 2016 | $2,168 | $35,020 | $8,720 | $26,300 |
| 2015 | $2,166 | $35,020 | $8,720 | $26,300 |
| 2014 | $2,167 | $35,020 | $8,720 | $26,300 |
| 2013 | $1,567 | $35,020 | $8,720 | $26,300 |
Source: Public Records
Map
Nearby Homes