Estimated Value: $213,172 - $290,000
--
Bed
1
Bath
1,232
Sq Ft
$199/Sq Ft
Est. Value
About This Home
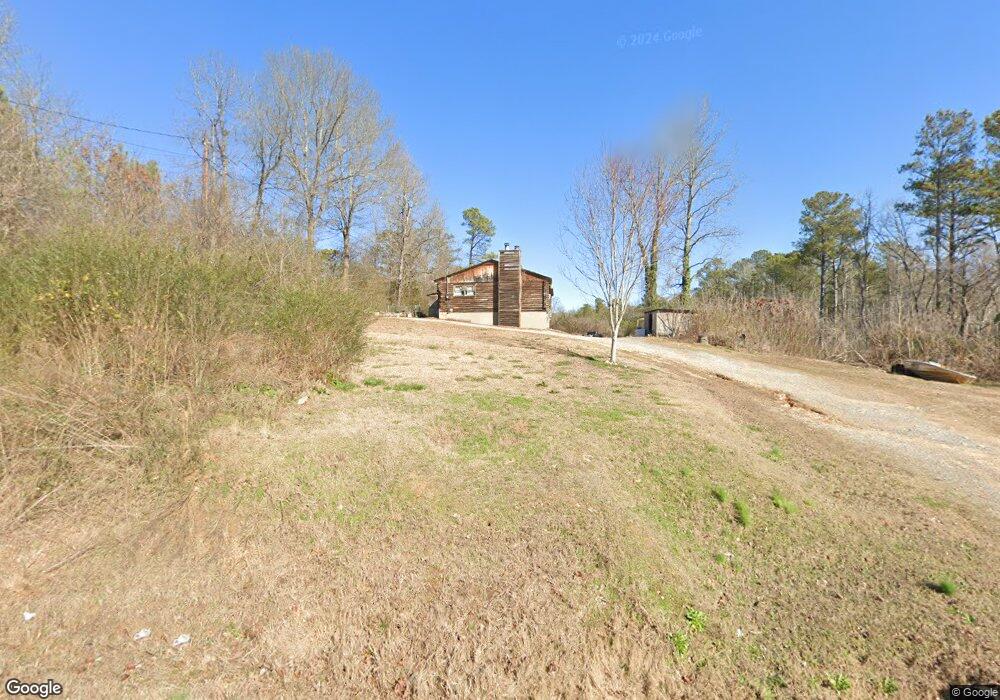
This home is located at 2393 Kingston Hwy NE, Rome, GA 30161 and is currently estimated at $244,793, approximately $198 per square foot. 2393 Kingston Hwy NE is a home located in Floyd County with nearby schools including Model Middle School, Model High School, and Unity Christian School.
Ownership History
Date
Name
Owned For
Owner Type
Purchase Details
Closed on
Dec 29, 2015
Sold by
Messex Carey Mitchell
Bought by
Messex Carey Mitchell Estate
Current Estimated Value
Purchase Details
Closed on
Apr 29, 2008
Sold by
Not Provided
Bought by
Messex Carey Mitchell
Purchase Details
Closed on
Dec 18, 2000
Sold by
Drummond Dean and Jordan James B
Bought by
Wiggins Michael
Purchase Details
Closed on
Sep 6, 2000
Sold by
Mahon Susan and Nancy Sears
Bought by
Drummond Dean and Jordan James B
Purchase Details
Closed on
Mar 31, 1999
Sold by
Carnes Florence S
Bought by
Mahon Susan and Nancy Sears
Purchase Details
Closed on
Mar 21, 1997
Sold by
Carnes Florence S
Bought by
Carnes Florence S
Purchase Details
Closed on
Jul 10, 1991
Bought by
P and R
Purchase Details
Closed on
Jun 27, 1991
Sold by
Carnes Henry H and Carnes Florence B
Bought by
Carnes Florence S
Purchase Details
Closed on
Jan 1, 1988
Bought by
P and R
Purchase Details
Closed on
Dec 7, 1981
Bought by
P and R
Create a Home Valuation Report for This Property
The Home Valuation Report is an in-depth analysis detailing your home's value as well as a comparison with similar homes in the area
Home Values in the Area
Average Home Value in this Area
Purchase History
| Date | Buyer | Sale Price | Title Company |
|---|---|---|---|
| Messex Carey Mitchell Estate | -- | -- | |
| Messex Carey Mitchell | -- | -- | |
| Messex Carey Mitchell | -- | -- | |
| Wiggins Michael | $79,000 | -- | |
| Drummond Dean | $50,300 | -- | |
| Mahon Susan | -- | -- | |
| Carnes Florence S | -- | -- | |
| P | -- | -- | |
| Carnes Florence S | -- | -- | |
| P | -- | -- | |
| P | -- | -- | |
| Carnes Henry H | $3,600 | -- |
Source: Public Records
Tax History Compared to Growth
Tax History
| Year | Tax Paid | Tax Assessment Tax Assessment Total Assessment is a certain percentage of the fair market value that is determined by local assessors to be the total taxable value of land and additions on the property. | Land | Improvement |
|---|---|---|---|---|
| 2024 | $2,582 | $84,231 | $14,837 | $69,394 |
| 2023 | $2,410 | $72,374 | $13,488 | $58,886 |
| 2022 | $1,793 | $60,421 | $11,128 | $49,293 |
| 2021 | $1,471 | $48,746 | $10,127 | $38,619 |
| 2020 | $1,293 | $42,469 | $8,806 | $33,663 |
| 2019 | $1,242 | $41,338 | $8,806 | $32,532 |
| 2018 | $1,196 | $39,742 | $8,388 | $31,354 |
| 2017 | $1,162 | $38,541 | $7,767 | $30,774 |
| 2016 | $1,172 | $38,426 | $7,760 | $30,666 |
| 2015 | $464 | $38,426 | $7,760 | $30,666 |
| 2014 | $464 | $38,426 | $7,760 | $30,666 |
Source: Public Records
Map
Nearby Homes
- 45 Wildflower Rd NE
- 0 N Quarters Dr Unit 7467468
- 0 N Quarters Dr Unit 37 10390869
- 25 Everwood Ct SE
- 21 Everwood Ct SE
- 0 Fallen Branch Cir SE Unit 7397536
- 0 Fallen Branch Cir SE Unit 10311756
- 0 Fallen Branch Cir SE Unit 7234792
- 0 Fallen Branch Cir SE Unit 10172755
- 16 Fallen Branch Cir SE
- 3 Outpost Trail SE
- 1 Outpost Trail SE
- 0 Moran Lake Rd NE Unit 10592848
- 0 Moran Lake Rd NE Unit 7639960
- 0 Moran Lake Rd NE Unit 229 10584708
- 11 Parkwood Dr NE
- 230 Old Freeman Ferry Rd SE
- 0 Old Freeman Ferry Rd SE Unit 10611047
- 121 Hasty Rd NE
- 492 Moran Lake Rd NE
- 40 Wildflower Rd NE
- 2408 Kingston Hwy SE
- 0 Garrard Rd SE
- 0 Garrard Rd SE Unit 7439764
- 0 Garrard Rd SE Unit 3226282
- 0 Garrard Rd SE Unit 8329335
- 0 Garrard Rd SE Unit 8128632
- 0 Garrard Rd SE Unit 7606222
- 0 Garrard Rd SE Unit 8283934
- 0 Garrard Rd SE Unit 8049538
- 65 Wildflower Rd NE
- 65 Wildflower Rd NE Unit 1
- 39 Beard Lake Rd SE
- 90 Wildflower Rd NE
- 2338 Kingston Hwy SE
- 2324 Kingston Hwy SE
- 26 Garrard Rd SE
- 15 Southern Grace Place NE
- 2434 Kingston Hwy NE
- 29 Southern Grace Place NE Unit 2