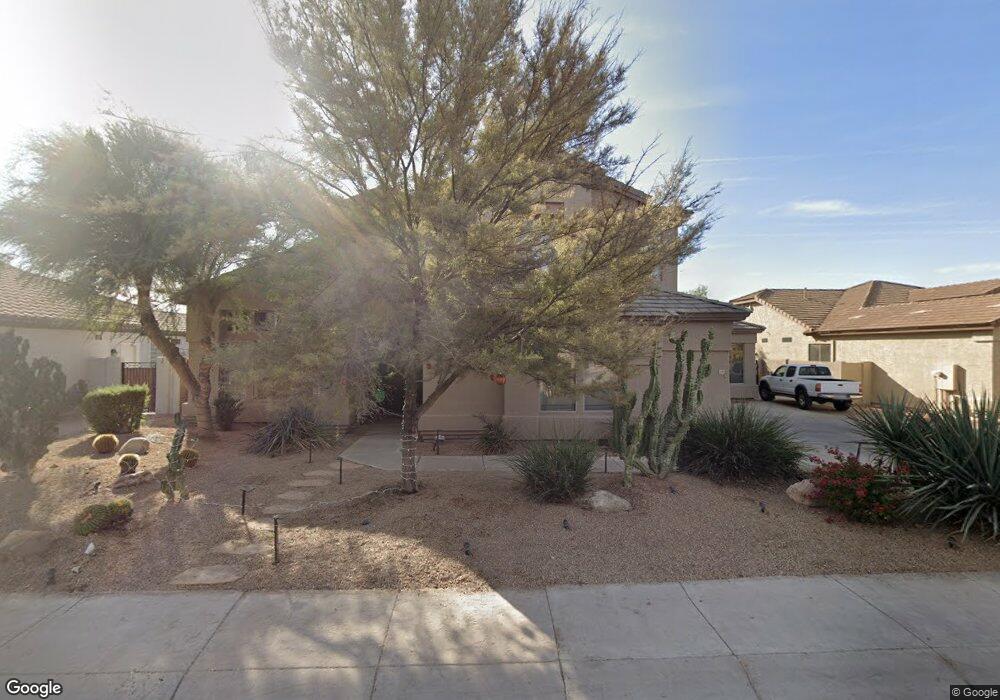
2393 W Enfield Way Chandler, AZ 85286
Central Chandler NeighborhoodEstimated Value: $885,000 - $1,026,000
--
Bed
4
Baths
4,009
Sq Ft
$231/Sq Ft
Est. Value
About This Home
This home is located at 2393 W Enfield Way, Chandler, AZ 85286 and is currently estimated at $926,387, approximately $231 per square foot. 2393 W Enfield Way is a home located in Maricopa County with nearby schools including Robert and Danell Tarwater Elementary School, Bogle Junior High School, and Hamilton High School.
Ownership History
Date
Name
Owned For
Owner Type
Purchase Details
Closed on
Oct 11, 2001
Sold by
Black David P and Black Lisa
Bought by
Quan Derek and Quan Katherine
Current Estimated Value
Home Financials for this Owner
Home Financials are based on the most recent Mortgage that was taken out on this home.
Original Mortgage
$275,000
Interest Rate
6.91%
Mortgage Type
New Conventional
Purchase Details
Closed on
Jun 15, 1999
Sold by
Jackson Properties Inc
Bought by
Black David P and Black Lisa
Home Financials for this Owner
Home Financials are based on the most recent Mortgage that was taken out on this home.
Original Mortgage
$239,150
Interest Rate
7.63%
Mortgage Type
Seller Take Back
Create a Home Valuation Report for This Property
The Home Valuation Report is an in-depth analysis detailing your home's value as well as a comparison with similar homes in the area
Home Values in the Area
Average Home Value in this Area
Purchase History
| Date | Buyer | Sale Price | Title Company |
|---|---|---|---|
| Quan Derek | $387,000 | First American Title | |
| Black David P | $332,071 | Stewart Title & Trust | |
| Jackson Properties Inc | -- | Stewart Title & Trust |
Source: Public Records
Mortgage History
| Date | Status | Borrower | Loan Amount |
|---|---|---|---|
| Closed | Quan Derek | $275,000 | |
| Previous Owner | Black David P | $239,150 | |
| Closed | Black David P | $237,225 |
Source: Public Records
Tax History Compared to Growth
Tax History
| Year | Tax Paid | Tax Assessment Tax Assessment Total Assessment is a certain percentage of the fair market value that is determined by local assessors to be the total taxable value of land and additions on the property. | Land | Improvement |
|---|---|---|---|---|
| 2025 | $4,384 | $53,300 | -- | -- |
| 2024 | $4,210 | $50,762 | -- | -- |
| 2023 | $4,210 | $62,600 | $12,520 | $50,080 |
| 2022 | $4,058 | $47,620 | $9,520 | $38,100 |
| 2021 | $4,188 | $45,580 | $9,110 | $36,470 |
| 2020 | $4,161 | $44,020 | $8,800 | $35,220 |
| 2019 | $3,994 | $43,270 | $8,650 | $34,620 |
| 2018 | $3,864 | $41,980 | $8,390 | $33,590 |
| 2017 | $3,593 | $41,960 | $8,390 | $33,570 |
| 2016 | $3,450 | $44,850 | $8,970 | $35,880 |
| 2015 | $3,284 | $37,470 | $7,490 | $29,980 |
Source: Public Records
Map
Nearby Homes
- 2351 W Maplewood St
- 2491 W Mulberry Dr
- 2109 W Wildhorse Dr
- 2005 W Longhorn Dr
- 1874 W Musket Way
- 1913 W Remington Dr
- 1892 W Wildhorse Dr
- 1838 W Enfield Way
- 1831 W Armstrong Way
- 1751 W Mulberry Dr
- 1770 W Mulberry Dr
- 1832 W Wildhorse Dr
- 1694 S Villas Ln
- 1779 W Stonefield Dr
- 1861 W Pelican Dr
- 1627 W Maplewood St
- 1470 S Villas Ct
- 1563 S Pennington Dr
- 1708 W Seagull Ct
- 1574 W Maplewood St
- 2413 W Enfield Way
- 2373 W Enfield Way
- 2410 W Thompson Way
- 2420 W Thompson Way
- 2353 W Enfield Way
- 2423 W Enfield Way
- 2400 W Thompson Way
- 2392 W Enfield Way
- 2430 W Thompson Way
- 2412 W Enfield Way
- 2372 W Enfield Way
- 2390 W Thompson Way
- 2440 W Thompson Way
- 2433 W Enfield Way
- 2352 W Enfield Way
- 2333 W Enfield Way
- 2432 W Enfield Way
- 2380 W Thompson Way
- 2391 W Maplewood St
- 2450 W Thompson Way