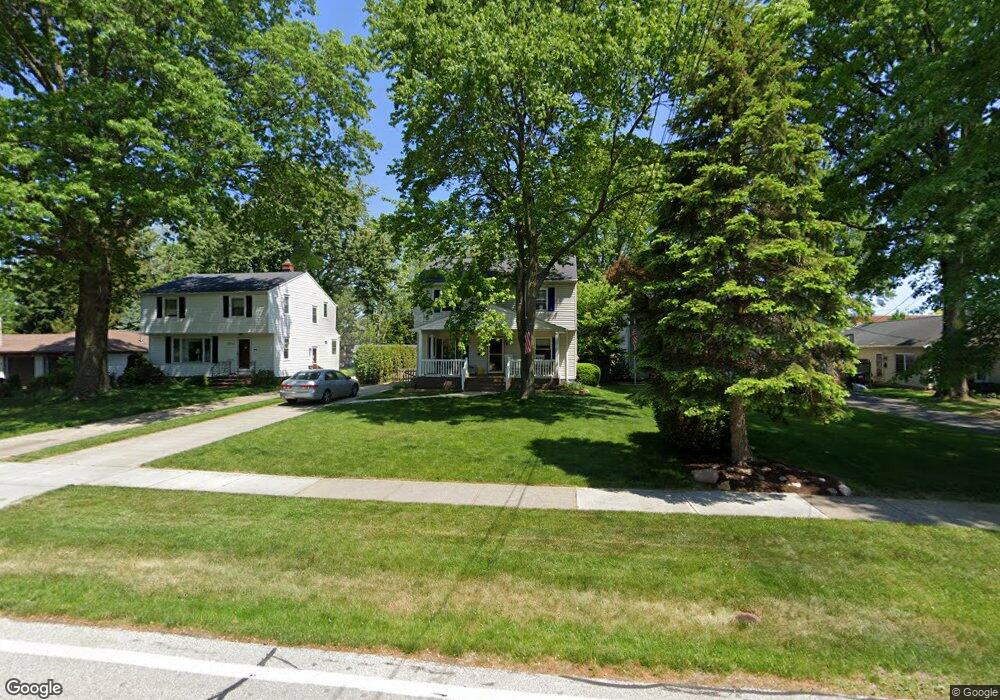
23930 Hedgewood Ave Westlake, OH 44145
Estimated Value: $279,000 - $329,000
3
Beds
2
Baths
1,560
Sq Ft
$197/Sq Ft
Est. Value
About This Home
This home is located at 23930 Hedgewood Ave, Westlake, OH 44145 and is currently estimated at $307,568, approximately $197 per square foot. 23930 Hedgewood Ave is a home located in Cuyahoga County with nearby schools including Dover Intermediate School, Lee Burneson Middle School, and Westlake High School.
Ownership History
Date
Name
Owned For
Owner Type
Purchase Details
Closed on
Mar 17, 1999
Sold by
Wendling Patrick J and Wendling Dawn M
Bought by
Altman William G and Altman Elizabeth B
Current Estimated Value
Home Financials for this Owner
Home Financials are based on the most recent Mortgage that was taken out on this home.
Original Mortgage
$149,310
Outstanding Balance
$36,290
Interest Rate
6.8%
Estimated Equity
$271,278
Purchase Details
Closed on
Feb 25, 1999
Sold by
Yagich James E and Yagich Penny A
Bought by
Wendling Patrick J and Wendling Dawn M
Home Financials for this Owner
Home Financials are based on the most recent Mortgage that was taken out on this home.
Original Mortgage
$149,310
Outstanding Balance
$36,290
Interest Rate
6.8%
Estimated Equity
$271,278
Purchase Details
Closed on
Dec 9, 1992
Sold by
Hruschak Audrey F
Bought by
Yagich James E
Purchase Details
Closed on
Jan 1, 1975
Bought by
Hruschak Audrey F
Create a Home Valuation Report for This Property
The Home Valuation Report is an in-depth analysis detailing your home's value as well as a comparison with similar homes in the area
Home Values in the Area
Average Home Value in this Area
Purchase History
| Date | Buyer | Sale Price | Title Company |
|---|---|---|---|
| Altman William G | $165,900 | Midland Title Security Inc | |
| Wendling Patrick J | -- | Midland Title Security Inc | |
| Yagich James E | $70,500 | -- | |
| Hruschak Audrey F | -- | -- |
Source: Public Records
Mortgage History
| Date | Status | Borrower | Loan Amount |
|---|---|---|---|
| Open | Altman William G | $149,310 |
Source: Public Records
Tax History Compared to Growth
Tax History
| Year | Tax Paid | Tax Assessment Tax Assessment Total Assessment is a certain percentage of the fair market value that is determined by local assessors to be the total taxable value of land and additions on the property. | Land | Improvement |
|---|---|---|---|---|
| 2024 | $4,544 | $93,730 | $14,875 | $78,855 |
| 2023 | $3,700 | $65,280 | $12,570 | $52,710 |
| 2022 | $3,643 | $65,275 | $12,565 | $52,710 |
| 2021 | $3,615 | $64,650 | $12,570 | $52,080 |
| 2020 | $3,369 | $55,270 | $10,750 | $44,520 |
| 2019 | $3,315 | $157,900 | $30,700 | $127,200 |
| 2018 | $3,283 | $55,270 | $10,750 | $44,520 |
| 2017 | $3,360 | $52,470 | $8,370 | $44,100 |
| 2016 | $3,343 | $52,470 | $8,370 | $44,100 |
| 2015 | $3,263 | $52,470 | $8,370 | $44,100 |
| 2014 | $3,263 | $50,930 | $8,120 | $42,810 |
Source: Public Records
Map
Nearby Homes
- 2375 Clague Rd
- 23547 Quail Hollow
- 24336 Smith Ave
- 24363 Smith Ave
- 2045 Clague Rd
- 24225 Stonehedge Dr
- 24407 Westwood Rd
- 1874 Donna Dr
- 24217 Vincent Dr
- 23240 Pheasant Ln Unit 7
- 1811 Clague Rd
- 24502 Cornerstone
- 23782 Cornwell Dr
- 1787 Donna Dr
- 1851 King James Pkwy Unit 114
- 23225 Marion Rd
- 23181 Marion Rd
- 24500 Westwood Rd
- 1931 King James Pkwy Unit 427
- 23205 Clifford Dr
- 23926 Hedgewood Ave
- 23936 Hedgewood Ave
- 23900 Hedgewood Ave
- 23942 Hedgewood Ave
- 23894 Hedgewood Ave
- 24000 Hedgewood Ave
- 23888 Hedgewood Ave
- 23895 Hedgewood Ave
- 23872 Hedgewood Ave
- 24060 Hedgewood Ave
- 23929 Hedgewood Ave
- 23903 Hedgewood Ave
- 23941 Hedgewood Ave
- 23987 Hedgewood Ave
- 23858 Hedgewood Ave
- 24092 Hedgewood Ave
- 23891 Hedgewood Ave
- 23887 Hedgewood Ave
- 23824 Hedgewood Ave
- 24001 Hedgewood Ave