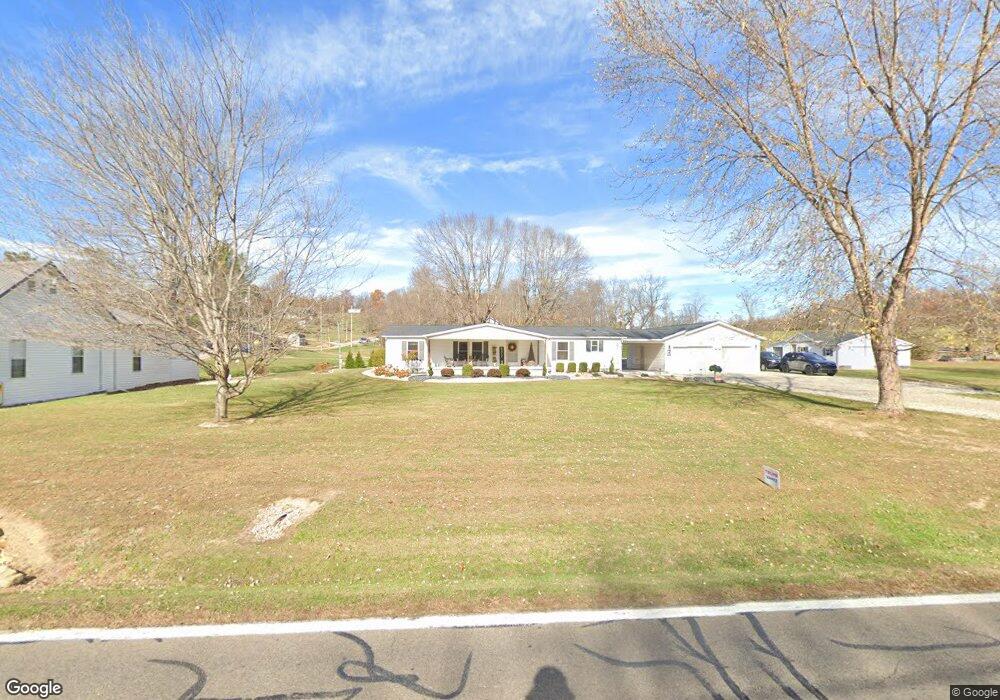
23949 State Route 93 Wellston, OH 45692
Estimated Value: $120,000 - $150,000
2
Beds
1
Bath
1,204
Sq Ft
$108/Sq Ft
Est. Value
About This Home
This home is located at 23949 State Route 93, Wellston, OH 45692 and is currently estimated at $130,295, approximately $108 per square foot. 23949 State Route 93 is a home located in Jackson County with nearby schools including Bundy Elementary School, Wellston Intermediate School, and Wellston Middle School.
Ownership History
Date
Name
Owned For
Owner Type
Purchase Details
Closed on
Aug 29, 2022
Sold by
Cutlip Principal Protection Trust
Bought by
Williams Leonard
Current Estimated Value
Home Financials for this Owner
Home Financials are based on the most recent Mortgage that was taken out on this home.
Original Mortgage
$80,750
Outstanding Balance
$77,178
Interest Rate
5.3%
Mortgage Type
New Conventional
Estimated Equity
$53,117
Purchase Details
Closed on
Mar 29, 2017
Sold by
Jeffers Joyce E
Bought by
Jeffers Joyce E and Joyce E Jeffers Trust
Purchase Details
Closed on
Sep 15, 2015
Sold by
Cutlip Ruth Joan and Cutlip Joan R
Bought by
Meacham Lisa G and The Cutlip Principal Protectio
Purchase Details
Closed on
Oct 8, 2013
Sold by
Williams Irene
Bought by
Cutlip R Joan and Jeffers Joyce
Create a Home Valuation Report for This Property
The Home Valuation Report is an in-depth analysis detailing your home's value as well as a comparison with similar homes in the area
Home Values in the Area
Average Home Value in this Area
Purchase History
| Date | Buyer | Sale Price | Title Company |
|---|---|---|---|
| Williams Leonard | $85,000 | Northwest Title | |
| Williams Leonard | $85,000 | Northwest Title | |
| Bentley Joyce E | $375 | Northwest Title | |
| Bentley Joyce E | $375 | Northwest Title | |
| Jeffers Joyce E | -- | Northwest Title | |
| Meacham Lisa G | -- | None Available | |
| Cutlip R Joan | $16,603 | None Available |
Source: Public Records
Mortgage History
| Date | Status | Borrower | Loan Amount |
|---|---|---|---|
| Open | Williams Leonard | $80,750 | |
| Closed | Williams Leonard | $80,750 |
Source: Public Records
Tax History Compared to Growth
Tax History
| Year | Tax Paid | Tax Assessment Tax Assessment Total Assessment is a certain percentage of the fair market value that is determined by local assessors to be the total taxable value of land and additions on the property. | Land | Improvement |
|---|---|---|---|---|
| 2024 | $897 | $29,380 | $5,600 | $23,780 |
| 2023 | $897 | $29,380 | $5,600 | $23,780 |
| 2022 | $836 | $21,880 | $4,470 | $17,410 |
| 2021 | $704 | $21,880 | $4,470 | $17,410 |
| 2020 | $741 | $21,880 | $4,470 | $17,410 |
| 2019 | $664 | $19,020 | $3,890 | $15,130 |
| 2018 | $641 | $19,020 | $3,890 | $15,130 |
| 2017 | $600 | $19,020 | $3,890 | $15,130 |
| 2016 | $593 | $18,420 | $4,550 | $13,870 |
| 2015 | $592 | $18,420 | $4,550 | $13,870 |
| 2013 | $284 | $17,830 | $4,550 | $13,280 |
| 2012 | $287 | $17,830 | $4,550 | $13,280 |
Source: Public Records
Map
Nearby Homes
- 23711 Ohio 93
- 1040 W Broadway St
- 0 Womeldorf Ln
- 374 Exline Rd
- 11834 Ohio 327
- 4826 Ohio 788
- 552 W B St
- 238 S Wisconsin Ave
- 629 W D St
- 224 W 4th St
- 103 Meadow Run Rd
- 103&103B Meadow Run
- 616 S Michigan Ave
- 21 S Michigan Ave
- 222 N Michigan Ave
- 16 E Broadway St
- 0 Ohio 327
- 1433 S Pennsylvania Ave
- 408 N Park Ave
- 224 E 2nd St
- 23937 State Route 93
- 23957 State Route 93
- 23945 State Route 93
- 23945 State Route 93
- 24041 State Route 93
- 23877 State Route 93
- 24042 State Route 93
- 23934 State Route 93
- 23881 State Route 93
- 23881 Ohio 93
- 23885 State Route 93
- 24074 State Route 93
- 23892 State Route 93
- 23947 State Route 93
- 23867 State Route 93
- 23863 State Route 93
- 23887 Ohio 93
- 23869 Ohio 93
- 23869 State Route 93
- 24165 State Route 93