T
Landlord's Agent in 2022
Tanika Tanika Ford
Progress Residential Property Manager, LLC.
Estimated Value: $352,000 - $400,988
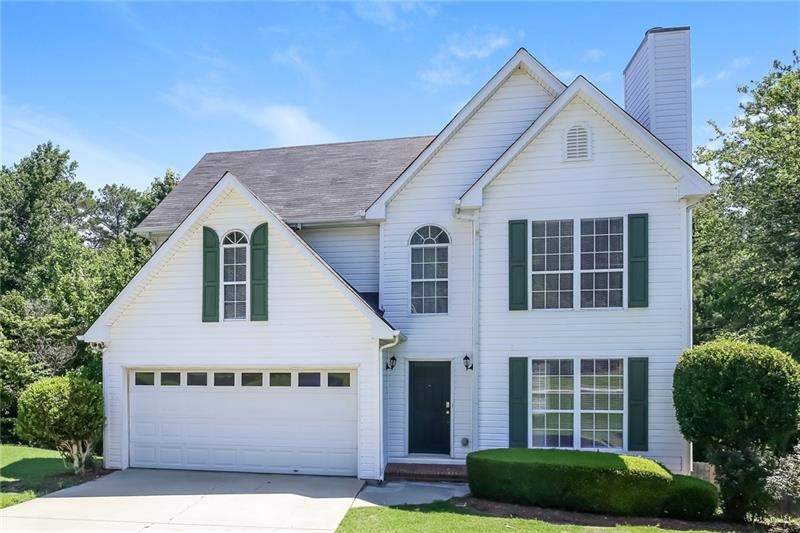
Like all our homes, this one features: a great location in a desirable neighborhood, a comfortable layout with good-sized bedrooms and bathrooms, a great kitchen with plenty of counter and cabinet space, many updated and upgraded features, central HVAC and programmable thermostat, garage and a spacious yard, and it's pet friendly.
Last Agent to Rent the Property
Tanika Tanika Ford
Progress Residential Property Manager, LLC. License #334101 Listed on: 07/01/2022
Last Renter's Agent
Tanika Tanika Ford
Progress Residential Property Manager, LLC. License #334101 Listed on: 07/01/2022
| Date | Buyer | Sale Price | Title Company |
|---|---|---|---|
| Rha 1 Llc | $107,500 | -- | |
| Hodges Susan K | $201,500 | -- | |
| Jay Bullock Communities Inc | $22,500 | -- |
| Date | Status | Borrower | Loan Amount |
|---|---|---|---|
| Previous Owner | Jay Bullock Communities Inc | $76,100 |
| Date | Event | Price | List to Sale | Price per Sq Ft | Prior Sale |
|---|---|---|---|---|---|
| 09/09/2022 09/09/22 | Rented | $2,185 | 0.0% | -- | |
| 08/30/2022 08/30/22 | Under Contract | -- | -- | -- | |
| 08/29/2022 08/29/22 | Price Changed | $2,185 | -2.9% | $1 / Sq Ft | |
| 08/24/2022 08/24/22 | For Rent | $2,250 | 0.0% | -- | |
| 08/19/2022 08/19/22 | Under Contract | -- | -- | -- | |
| 08/17/2022 08/17/22 | Price Changed | $2,250 | -1.1% | $1 / Sq Ft | |
| 08/16/2022 08/16/22 | Price Changed | $2,275 | -0.9% | $1 / Sq Ft | |
| 08/02/2022 08/02/22 | Price Changed | $2,295 | -2.1% | $1 / Sq Ft | |
| 07/27/2022 07/27/22 | Price Changed | $2,345 | -0.4% | $1 / Sq Ft | |
| 07/21/2022 07/21/22 | Price Changed | $2,355 | +1.1% | $1 / Sq Ft | |
| 07/20/2022 07/20/22 | For Rent | $2,330 | 0.0% | -- | |
| 07/06/2022 07/06/22 | Under Contract | -- | -- | -- | |
| 07/01/2022 07/01/22 | For Rent | $2,330 | +67.0% | -- | |
| 09/02/2016 09/02/16 | Rented | $1,395 | 0.0% | -- | |
| 08/30/2016 08/30/16 | Price Changed | $1,395 | -2.8% | $1 / Sq Ft | |
| 08/26/2016 08/26/16 | For Rent | $1,435 | 0.0% | -- | |
| 08/24/2016 08/24/16 | Off Market | $1,435 | -- | -- | |
| 08/10/2016 08/10/16 | For Rent | $1,435 | +10.4% | -- | |
| 05/06/2014 05/06/14 | Rented | $1,300 | 0.0% | -- | |
| 05/06/2014 05/06/14 | For Rent | $1,300 | 0.0% | -- | |
| 04/05/2014 04/05/14 | Rented | $1,300 | 0.0% | -- | |
| 03/25/2014 03/25/14 | Under Contract | -- | -- | -- | |
| 12/30/2013 12/30/13 | For Rent | $1,300 | 0.0% | -- | |
| 10/22/2013 10/22/13 | Sold | $107,500 | -2.3% | $60 / Sq Ft | View Prior Sale |
| 09/27/2013 09/27/13 | For Sale | $110,000 | -- | $62 / Sq Ft |
| Year | Tax Paid | Tax Assessment Tax Assessment Total Assessment is a certain percentage of the fair market value that is determined by local assessors to be the total taxable value of land and additions on the property. | Land | Improvement |
|---|---|---|---|---|
| 2025 | $6,049 | $163,560 | $34,000 | $129,560 |
| 2024 | $5,309 | $163,560 | $34,000 | $129,560 |
| 2023 | $5,309 | $144,600 | $30,400 | $114,200 |
| 2022 | $3,610 | $92,000 | $20,720 | $71,280 |
| 2021 | $3,650 | $92,000 | $20,720 | $71,280 |
| 2020 | $3,968 | $100,200 | $20,720 | $79,480 |
| 2019 | $3,516 | $91,480 | $17,920 | $73,560 |
| 2018 | $2,572 | $64,480 | $14,400 | $50,080 |
| 2016 | $2,851 | $71,960 | $14,400 | $57,560 |
| 2015 | $2,666 | $65,920 | $12,000 | $53,920 |
| 2014 | $1,862 | $43,000 | $12,000 | $31,000 |
T
Landlord's Agent in 2022
Tanika Tanika Ford
Progress Residential Property Manager, LLC.
G
Seller's Agent in 2016
Gilnnie Mendez
The Atlanta Key Firm, LLC

Seller's Agent in 2014
Michelle Graves
Presley Roth Real Estate
(678) 858-8461
104 Total Sales
Buyer's Agent in 2014
Glenda Broker
Non-Mls Company
(800) 289-1214
S
Seller's Agent in 2013
Susan Bullock
Premier Realty Associates, Inc.
(404) 805-8000
28 Total Sales
Buyer's Agent in 2013
Julie Colquitt
Sylvan Realty, LLC.
(404) 522-4008
5 in this area
2,982 Total Sales
Source: First Multiple Listing Service (FMLS)
MLS Number: 7076422
APN: 1-002B-051
Disclaimer: Certain information contained herein is derived from information provided by parties other than Homes.com. All information provided is deemed reliable, but is not guaranteed to be accurate and should be independently verified.
![]() Listings identified with the FMLS IDX logo come from FMLS and are held by brokerage firms other than the owner of this website. The listing brokerage is identified in any listing details. Information is deemed reliable but is not guaranteed. If you believe any FMLS listing contains material that infringes your copyrighted work please visit www.fmls.com/dmca to review our DMCA policy and learn how to submit a takedown request. © 2025 First Multiple Listing Service, Inc.
Listings identified with the FMLS IDX logo come from FMLS and are held by brokerage firms other than the owner of this website. The listing brokerage is identified in any listing details. Information is deemed reliable but is not guaranteed. If you believe any FMLS listing contains material that infringes your copyrighted work please visit www.fmls.com/dmca to review our DMCA policy and learn how to submit a takedown request. © 2025 First Multiple Listing Service, Inc.