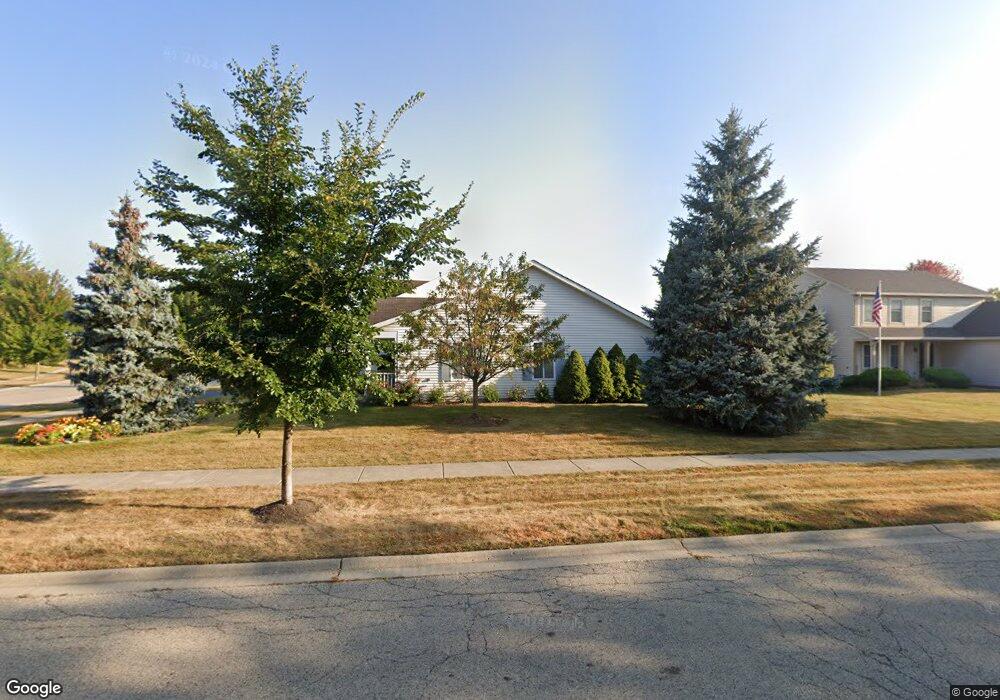
2395 N Tedy Ln Round Lake Beach, IL 60073
Estimated Value: $269,528 - $316,000
3
Beds
1
Bath
1,100
Sq Ft
$268/Sq Ft
Est. Value
About This Home
This home is located at 2395 N Tedy Ln, Round Lake Beach, IL 60073 and is currently estimated at $294,382, approximately $267 per square foot. 2395 N Tedy Ln is a home located in Lake County with nearby schools including Avon Center Elementary School, Frederick School, and Grayslake Middle School.
Ownership History
Date
Name
Owned For
Owner Type
Purchase Details
Closed on
Aug 25, 2025
Sold by
Hendrickson Darrel R and Hendrickson Susan M
Bought by
Capp Investments Llc
Current Estimated Value
Purchase Details
Closed on
May 22, 2003
Sold by
Budzynski Mitchell M and Budzynski Barbara
Bought by
Hendrickson Darrel R and Hendrickson Susan M
Home Financials for this Owner
Home Financials are based on the most recent Mortgage that was taken out on this home.
Original Mortgage
$125,000
Interest Rate
6.33%
Mortgage Type
Purchase Money Mortgage
Purchase Details
Closed on
Mar 13, 2000
Sold by
Lakewood Hills Llc
Bought by
Budzynski Mitchell M and Budzynski Barbara
Home Financials for this Owner
Home Financials are based on the most recent Mortgage that was taken out on this home.
Original Mortgage
$66,300
Interest Rate
8.39%
Create a Home Valuation Report for This Property
The Home Valuation Report is an in-depth analysis detailing your home's value as well as a comparison with similar homes in the area
Home Values in the Area
Average Home Value in this Area
Purchase History
| Date | Buyer | Sale Price | Title Company |
|---|---|---|---|
| Capp Investments Llc | $235,000 | Chicago Title | |
| Hendrickson Darrel R | $165,500 | -- | |
| Budzynski Mitchell M | $136,500 | Chicago Title Insurance Co |
Source: Public Records
Mortgage History
| Date | Status | Borrower | Loan Amount |
|---|---|---|---|
| Previous Owner | Hendrickson Darrel R | $125,000 | |
| Previous Owner | Budzynski Mitchell M | $66,300 |
Source: Public Records
Tax History Compared to Growth
Tax History
| Year | Tax Paid | Tax Assessment Tax Assessment Total Assessment is a certain percentage of the fair market value that is determined by local assessors to be the total taxable value of land and additions on the property. | Land | Improvement |
|---|---|---|---|---|
| 2024 | $5,460 | $67,625 | $15,781 | $51,844 |
| 2023 | $5,198 | $59,750 | $13,943 | $45,807 |
| 2022 | $5,198 | $51,722 | $11,747 | $39,975 |
| 2021 | $4,916 | $48,046 | $10,912 | $37,134 |
| 2020 | $4,971 | $46,506 | $10,562 | $35,944 |
| 2019 | $4,789 | $44,696 | $10,151 | $34,545 |
| 2018 | $5,362 | $47,975 | $14,146 | $33,829 |
| 2017 | $5,383 | $46,696 | $13,769 | $32,927 |
| 2016 | $5,305 | $44,805 | $13,211 | $31,594 |
| 2015 | $5,194 | $41,847 | $12,339 | $29,508 |
| 2014 | $5,049 | $42,210 | $11,709 | $30,501 |
| 2012 | $4,804 | $42,413 | $11,765 | $30,648 |
Source: Public Records
Map
Nearby Homes
- 1290 E Fox Chase Dr Unit 1
- 278 Crozier Dr
- 250 Crozier Dr
- 2814 Phillip Dr
- 2755 Sheldon Rd
- 941 Martingale Ln
- 253 Frances Dr
- 2354 Scott Ct
- 239 Frances Dr
- 36661 N Oakwood Dr
- 211 Frances Dr
- 21556 W Sarah Dr
- 36664 N Helen Dr
- 21290 W Engle Dr
- 2325 N Lenox Ct
- 36909 N Marilyn Ln
- 36915 N Mary Dr
- 36866 N Nathan Hale Dr Unit N
- 681 E Peachtree Ln
- 21974 W Engle Dr
- 2399 N Tedy Ln
- 1224 E Komar Ln
- 1230 E Komar Ln
- 2407 N Tedy Ln
- 1211 E Komar Ln
- 1201 E Komar Ln Unit 1
- 1219 E Greystone Dr
- 1219 E Komar Ln
- 2386 N Tedy Ln
- 1229 E Greystone Dr Unit 1
- 1240 E Komar Ln
- 1229 E Komar Ln
- 2374 N Tedy Ln Unit 1
- 2404 N Tedy Ln
- 1237 E Greystone Dr
- 2361 N Tedy Ln
- 1239 E Komar Ln
- 1250 E Komar Ln
- 2364 N Tedy Ln
- 1245 E Greystone Dr