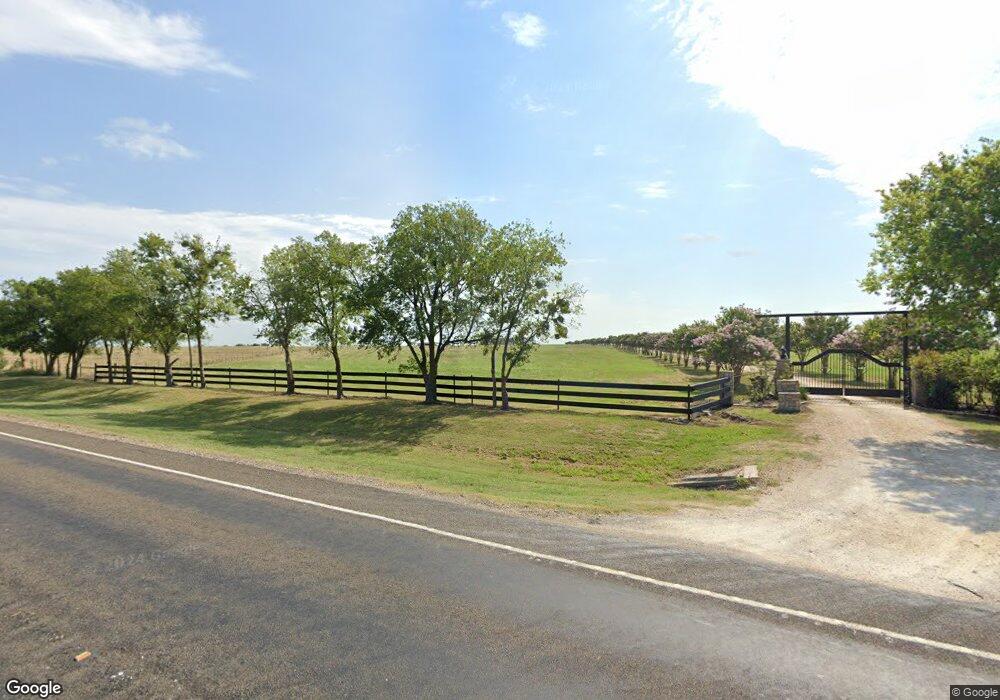
23950 Fm 485 Burlington, TX 76519
5
Beds
5
Baths
4,140
Sq Ft
109.88
Acres
About This Home
This home is located at 23950 Fm 485, Burlington, TX 76519. 23950 Fm 485 is a home located in Bell County with nearby schools including Rogers Elementary School, Rogers Middle, and Rogers High School.
Ownership History
Date
Name
Owned For
Owner Type
Purchase Details
Closed on
Jan 17, 2023
Sold by
Schiller Thomas Kenyon
Bought by
Diamond T Farms Llc
Purchase Details
Closed on
Sep 9, 2022
Sold by
Taylor Randal W
Bought by
Diamond T Farms Llc
Purchase Details
Closed on
Sep 24, 2019
Sold by
Smith Jacquolin L
Bought by
Taylor Randal W
Home Financials for this Owner
Home Financials are based on the most recent Mortgage that was taken out on this home.
Original Mortgage
$467,500
Interest Rate
3.6%
Mortgage Type
Commercial
Purchase Details
Closed on
Feb 14, 2008
Sold by
Witherspoon Jarold L
Bought by
Smith Jacquolin L
Purchase Details
Closed on
Dec 14, 2006
Sold by
Welch Gordon J and Welch Janet P
Bought by
Puana Rudolph B and Puana Lynn W
Home Financials for this Owner
Home Financials are based on the most recent Mortgage that was taken out on this home.
Original Mortgage
$585,000
Interest Rate
6.5%
Mortgage Type
Purchase Money Mortgage
Create a Home Valuation Report for This Property
The Home Valuation Report is an in-depth analysis detailing your home's value as well as a comparison with similar homes in the area
Home Values in the Area
Average Home Value in this Area
Purchase History
| Date | Buyer | Sale Price | Title Company |
|---|---|---|---|
| Diamond T Farms Llc | -- | Monteith Abstract & Title | |
| Diamond T Farms Llc | -- | First Community Title | |
| Taylor Randal W | -- | First Community Title Co | |
| Smith Jacquolin L | -- | First Community Title | |
| Puana Rudolph B | -- | Centraland Title Co |
Source: Public Records
Mortgage History
| Date | Status | Borrower | Loan Amount |
|---|---|---|---|
| Previous Owner | Taylor Randal W | $467,500 | |
| Previous Owner | Puana Rudolph B | $585,000 |
Source: Public Records
Tax History Compared to Growth
Tax History
| Year | Tax Paid | Tax Assessment Tax Assessment Total Assessment is a certain percentage of the fair market value that is determined by local assessors to be the total taxable value of land and additions on the property. | Land | Improvement |
|---|---|---|---|---|
| 2025 | $9,828 | $703,972 | $22,668 | $681,304 |
| 2024 | $9,828 | $673,709 | $22,232 | $651,477 |
| 2023 | $11,882 | $828,882 | $19,176 | $809,706 |
| 2022 | $10,558 | $652,243 | $19,120 | $633,123 |
| 2021 | $7,863 | $782,129 | $329,670 | $452,459 |
| 2020 | $4,197 | $554,165 | $329,670 | $224,495 |
| 2019 | $8,456 | $725,000 | $280,793 | $444,207 |
| 2018 | $9,125 | $810,134 | $329,640 | $480,494 |
| 2017 | $10,294 | $856,484 | $329,640 | $526,844 |
| 2016 | $9,915 | $718,340 | $208,597 | $509,743 |
| 2014 | $8,619 | $701,675 | $0 | $0 |
Source: Public Records
Map
Nearby Homes
- 0 Rosebud Rd
- TBD Rosebud Rd
- 0 Milam Rd
- 20474
- 876 S St Joseph Rd
- TBD Cr 132 #6
- 19081 Cyclone Branch Rd
- 19855 Fm 485 Hwy
- TBD Cr 132 #3
- 19845 Fm 485 Hwy
- TBD Cr 132 #1
- 19707 Fm 485
- TBD Big Elm Creek Rd
- 18543 Cyclone Branch Rd
- 1616 Farmers Rd
- TBD Farm To Market 1772 Unit CR363
- TBD Fm 2269 (Lot 16)
- TBD W Fm 485 (Lot 13) Rd
- TBD Fm 485
- 565 Fm 1772