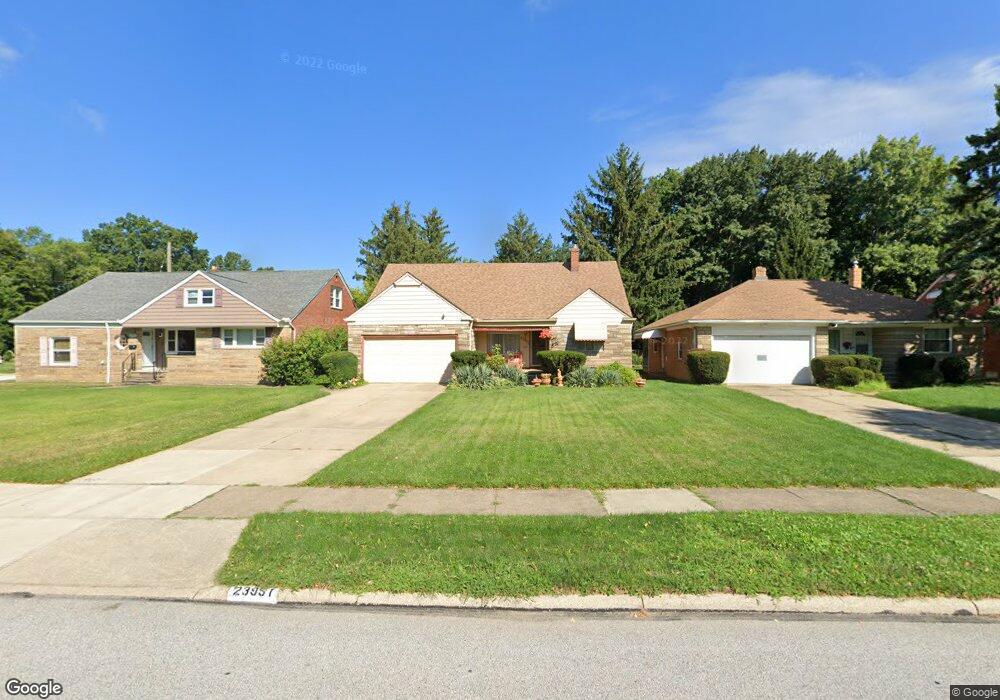
23951 Effingham Blvd Euclid, OH 44117
Estimated Value: $170,000 - $242,000
3
Beds
2
Baths
1,794
Sq Ft
$116/Sq Ft
Est. Value
About This Home
This home is located at 23951 Effingham Blvd, Euclid, OH 44117 and is currently estimated at $207,463, approximately $115 per square foot. 23951 Effingham Blvd is a home located in Cuyahoga County with nearby schools including Thomas Jefferson Elementary School, Euclid Middle School, and Euclid High School.
Ownership History
Date
Name
Owned For
Owner Type
Purchase Details
Closed on
Aug 19, 2010
Sold by
Stewart Verniki L and Jones Verniki L
Bought by
Stewart Verniki L
Current Estimated Value
Home Financials for this Owner
Home Financials are based on the most recent Mortgage that was taken out on this home.
Original Mortgage
$103,000
Outstanding Balance
$67,920
Interest Rate
4.49%
Mortgage Type
New Conventional
Estimated Equity
$139,543
Purchase Details
Closed on
Aug 17, 2000
Sold by
Jones Harland
Bought by
Jones Verniki L
Purchase Details
Closed on
Jun 23, 1997
Sold by
Stewart John M
Bought by
Jones Harland and Jones Verniki L
Home Financials for this Owner
Home Financials are based on the most recent Mortgage that was taken out on this home.
Original Mortgage
$123,497
Interest Rate
8.01%
Mortgage Type
New Conventional
Purchase Details
Closed on
Apr 3, 1985
Sold by
Stewart John M and D A
Bought by
Stewart John M and Stewart Dora A
Purchase Details
Closed on
Jan 1, 1975
Bought by
Stewart John M and D A
Create a Home Valuation Report for This Property
The Home Valuation Report is an in-depth analysis detailing your home's value as well as a comparison with similar homes in the area
Home Values in the Area
Average Home Value in this Area
Purchase History
| Date | Buyer | Sale Price | Title Company |
|---|---|---|---|
| Stewart Verniki L | -- | Attorney | |
| Jones Verniki L | -- | -- | |
| Jones Harland | $119,900 | -- | |
| Stewart John M | -- | -- | |
| Stewart John M | -- | -- |
Source: Public Records
Mortgage History
| Date | Status | Borrower | Loan Amount |
|---|---|---|---|
| Open | Stewart Verniki L | $103,000 | |
| Closed | Jones Harland | $123,497 |
Source: Public Records
Tax History Compared to Growth
Tax History
| Year | Tax Paid | Tax Assessment Tax Assessment Total Assessment is a certain percentage of the fair market value that is determined by local assessors to be the total taxable value of land and additions on the property. | Land | Improvement |
|---|---|---|---|---|
| 2024 | $4,050 | $60,585 | $11,165 | $49,420 |
| 2023 | $3,175 | $37,740 | $8,720 | $29,020 |
| 2022 | $3,100 | $37,730 | $8,720 | $29,020 |
| 2021 | $3,464 | $37,730 | $8,720 | $29,020 |
| 2020 | $3,283 | $32,550 | $7,530 | $25,030 |
| 2019 | $2,970 | $93,000 | $21,500 | $71,500 |
| 2018 | $3,001 | $32,550 | $7,530 | $25,030 |
| 2017 | $3,328 | $30,110 | $6,060 | $24,050 |
| 2016 | $3,920 | $35,570 | $6,060 | $29,510 |
| 2015 | $3,608 | $35,570 | $6,060 | $29,510 |
| 2014 | $3,608 | $35,570 | $6,060 | $29,510 |
Source: Public Records
Map
Nearby Homes
- 23751 Glenbrook Blvd
- 23795 Greenwood Rd
- 1696 E 236th St
- 1765 E 238th St
- 1775 E 228th St
- 1774 E 236th St
- 24105 Chardon Rd
- 2093 Newcome St
- 1620 E 243rd St
- 1554 E 221st St
- 21950 Euclid Ave
- 1851 Beverly Hills Dr
- 22261 Chardon Rd
- 24720 Dundee Dr
- 1865 Idlehurst Dr
- 2075 E 226th St
- 24691 Hawthorne Dr
- 25321 Chatworth Dr
- 1545 E 214th St
- 2111 Aberdeen Dr
- 23971 Effingham Blvd
- 23931 Effingham Blvd
- 23991 Effingham Blvd
- 23891 Effingham Blvd
- 23891 Greenwood Rd
- 23970 Effingham Blvd
- 23950 Effingham Blvd
- 23990 Effingham Blvd
- 23930 Effingham Blvd
- 23871 Effingham Blvd
- 23871 Greenwood Rd
- 23900 Effingham Blvd
- 23890 Greenwood Rd
- 23851 Effingham Blvd
- 23890 Effingham Blvd
- 23880 Greenwood Rd
- 23861 Greenwood Rd
- 1701 Sherwood Blvd
- 24002 Effingham Blvd
- 23870 Greenwood Rd