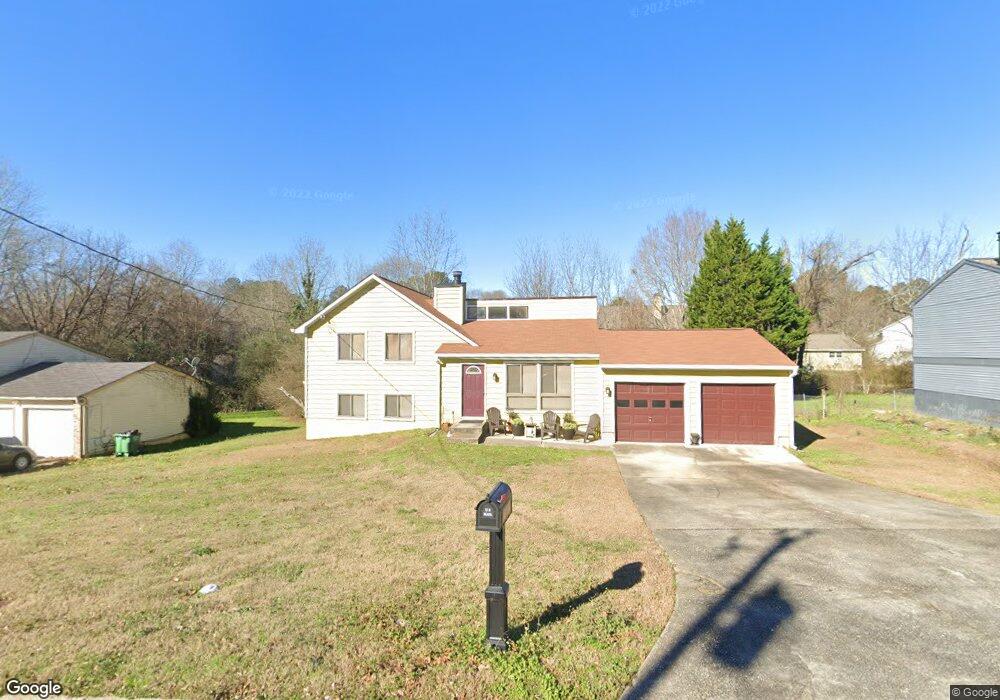
2397 Redfield Dr Unit 2 Norcross, GA 30071
Estimated Value: $315,000 - $362,000
3
Beds
2
Baths
1,000
Sq Ft
$333/Sq Ft
Est. Value
About This Home
This home is located at 2397 Redfield Dr Unit 2, Norcross, GA 30071 and is currently estimated at $333,324, approximately $333 per square foot. 2397 Redfield Dr Unit 2 is a home located in Gwinnett County with nearby schools including Beaver Ridge Elementary School, Summerour Middle School, and Norcross High School.
Ownership History
Date
Name
Owned For
Owner Type
Purchase Details
Closed on
Jun 11, 2024
Sold by
Greer-Thomas Mary
Bought by
Greer Mary W
Current Estimated Value
Purchase Details
Closed on
Oct 8, 2004
Sold by
Elm Street Investments Llc
Bought by
Greer-Thomas Mary
Home Financials for this Owner
Home Financials are based on the most recent Mortgage that was taken out on this home.
Original Mortgage
$128,000
Interest Rate
7.62%
Mortgage Type
New Conventional
Purchase Details
Closed on
Apr 30, 2004
Sold by
Summit Fndg
Bought by
Elm Street Investment Llc
Home Financials for this Owner
Home Financials are based on the most recent Mortgage that was taken out on this home.
Original Mortgage
$77,355
Interest Rate
5.38%
Purchase Details
Closed on
Apr 14, 2004
Sold by
Brooks Harold
Bought by
Summit Funding Llc
Home Financials for this Owner
Home Financials are based on the most recent Mortgage that was taken out on this home.
Original Mortgage
$77,355
Interest Rate
5.38%
Create a Home Valuation Report for This Property
The Home Valuation Report is an in-depth analysis detailing your home's value as well as a comparison with similar homes in the area
Home Values in the Area
Average Home Value in this Area
Purchase History
| Date | Buyer | Sale Price | Title Company |
|---|---|---|---|
| Greer Mary W | -- | -- | |
| Greer-Thomas Mary | $130,000 | -- | |
| Elm Street Investment Llc | $90,000 | -- | |
| Summit Funding Llc | -- | -- | |
| Summit Funding Llc | $76,600 | -- |
Source: Public Records
Mortgage History
| Date | Status | Borrower | Loan Amount |
|---|---|---|---|
| Previous Owner | Greer-Thomas Mary | $128,000 | |
| Previous Owner | Summit Funding Llc | $77,355 |
Source: Public Records
Tax History Compared to Growth
Tax History
| Year | Tax Paid | Tax Assessment Tax Assessment Total Assessment is a certain percentage of the fair market value that is determined by local assessors to be the total taxable value of land and additions on the property. | Land | Improvement |
|---|---|---|---|---|
| 2025 | $3,317 | $126,600 | $25,840 | $100,760 |
| 2024 | $3,141 | $110,320 | $25,600 | $84,720 |
| 2023 | $3,141 | $110,320 | $25,600 | $84,720 |
| 2022 | $2,888 | $99,920 | $23,200 | $76,720 |
| 2021 | $2,321 | $70,960 | $18,400 | $52,560 |
| 2020 | $2,267 | $67,760 | $16,000 | $51,760 |
| 2019 | $2,208 | $67,760 | $16,000 | $51,760 |
| 2018 | $2,000 | $58,240 | $13,600 | $44,640 |
| 2016 | $1,755 | $47,720 | $11,200 | $36,520 |
| 2015 | $1,441 | $38,320 | $8,000 | $30,320 |
| 2014 | -- | $33,360 | $8,000 | $25,360 |
Source: Public Records
Map
Nearby Homes
- 5045 Racquet Ct
- 4981 Sharp Way
- 4767 Glenwhite Dr
- 2318 Ingram Rd
- 2621 Bailey Dr
- 4880 Racquet Ct
- 2325 E Hill Way NW
- 4945 Clara Mae Walk
- 4242 Morrison Lake Trail
- 2385 Muirfield Way
- 4786 Masters Ct Unit 4
- 4935 Rockborough Trail
- 5041 Rockborough Trail Unit 3
- 5106 Rockborough Trail
- 5065 Rockborough Trail NW
- 5063 Micaela Way
- 5206 Westhill Dr NW
- 2387 Redfield Dr
- 2407 Redfield Dr
- 2349 Edge Ct
- 2343 Edge Ct
- 2377 Redfield Dr
- 2400 Redfield Dr Unit 2
- 2417 Redfield Dr
- 2355 Edge Ct
- 2337 Edge Ct
- 2370 Redfield Dr
- 2410 Redfield Dr Unit 2
- 2331 Edge Ct Unit 5
- 2361 Edge Ct Unit 5
- 2416 Redfield Dr Unit 2
- 2326 Redfield Dr Unit 2
- 2427 Redfield Dr
- 0 Edge Ct NW Unit 7527585
- 0 Edge Ct NW Unit 8015057
- 2367 Redfield Dr
- 2316 Redfield Dr