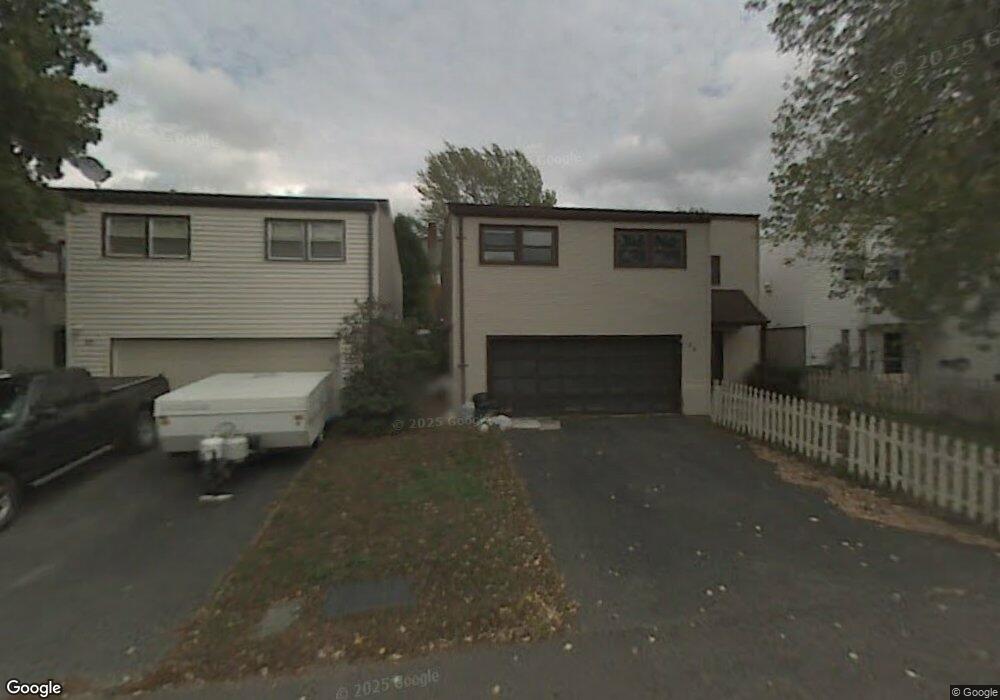
24 Afton Terrace Unit 24 Middletown, CT 06457
Westfield NeighborhoodEstimated Value: $236,000 - $281,755
3
Beds
1
Bath
1,000
Sq Ft
$262/Sq Ft
Est. Value
About This Home
This home is located at 24 Afton Terrace Unit 24, Middletown, CT 06457 and is currently estimated at $262,189, approximately $262 per square foot. 24 Afton Terrace Unit 24 is a home located in Middlesex County with nearby schools including Moody School.
Ownership History
Date
Name
Owned For
Owner Type
Purchase Details
Closed on
Dec 21, 2023
Sold by
Krich Properties Llc
Bought by
Sapp Mieshia
Current Estimated Value
Home Financials for this Owner
Home Financials are based on the most recent Mortgage that was taken out on this home.
Original Mortgage
$225,600
Outstanding Balance
$221,472
Interest Rate
7.5%
Mortgage Type
Purchase Money Mortgage
Estimated Equity
$40,717
Purchase Details
Closed on
Jul 25, 2023
Sold by
Holland Michael D
Bought by
Krich Properties Llc
Purchase Details
Closed on
Aug 5, 2008
Sold by
Department Of Housing & Urban Dev
Bought by
Mcwilliams Mark
Home Financials for this Owner
Home Financials are based on the most recent Mortgage that was taken out on this home.
Original Mortgage
$92,500
Interest Rate
6.47%
Mortgage Type
Purchase Money Mortgage
Purchase Details
Closed on
Dec 2, 2002
Sold by
Fleck Marlene D
Bought by
Johnson Dane T and Roy-Johnson Jill E
Create a Home Valuation Report for This Property
The Home Valuation Report is an in-depth analysis detailing your home's value as well as a comparison with similar homes in the area
Home Values in the Area
Average Home Value in this Area
Purchase History
| Date | Buyer | Sale Price | Title Company |
|---|---|---|---|
| Sapp Mieshia | $236,000 | None Available | |
| Krich Properties Llc | $165,000 | None Available | |
| Mcwilliams Mark | $92,100 | -- | |
| Johnson Dane T | $110,000 | -- |
Source: Public Records
Mortgage History
| Date | Status | Borrower | Loan Amount |
|---|---|---|---|
| Open | Sapp Mieshia | $225,600 | |
| Closed | Sapp Mieshia | $20,500 | |
| Previous Owner | Johnson Dane T | $2,250,000 | |
| Previous Owner | Johnson Dane T | $92,500 | |
| Previous Owner | Johnson Dane T | $10,600 |
Source: Public Records
Tax History Compared to Growth
Tax History
| Year | Tax Paid | Tax Assessment Tax Assessment Total Assessment is a certain percentage of the fair market value that is determined by local assessors to be the total taxable value of land and additions on the property. | Land | Improvement |
|---|---|---|---|---|
| 2025 | $4,445 | $131,960 | $44,190 | $87,770 |
| 2024 | $4,215 | $131,960 | $44,190 | $87,770 |
| 2023 | $3,359 | $111,810 | $44,190 | $67,620 |
| 2022 | $3,141 | $83,730 | $34,570 | $49,160 |
| 2021 | $3,134 | $83,730 | $34,570 | $49,160 |
| 2020 | $3,138 | $83,730 | $34,570 | $49,160 |
| 2019 | $3,155 | $83,730 | $34,570 | $49,160 |
| 2018 | $3,043 | $83,730 | $34,570 | $49,160 |
| 2017 | $2,938 | $82,870 | $32,130 | $50,740 |
| 2016 | $2,881 | $82,870 | $32,130 | $50,740 |
| 2015 | $2,819 | $82,870 | $32,130 | $50,740 |
| 2014 | $2,820 | $82,870 | $32,130 | $50,740 |
Source: Public Records
Map
Nearby Homes
- 67 Braeburn Ln
- 7 W Meadow Ln Unit 5
- 130 Carriage Crossing Ln Unit 130
- 48 Carriage Crossing Ln Unit 8108
- 7 Inverness Square
- 59 Inverness Ln
- 59 Fieldbrook Rd
- 886 East St
- 14 Rising Trail Dr
- 52 Rising Trail Dr
- 36 Rising Trail Dr Unit 36
- 100 Rising Trail Dr Unit 100
- 162 Rising Trail Dr
- 17 Flynn Ln
- 55 Timothy Dr
- 123 Burgundy Hill Ln
- 36 Burgundy Hill Ln
- 48 Burgundy Hill Ln Unit 48
- 56 Burgundy Hill Ln Unit 56
- 38 Burgundy Hill Ln
- 24 Afton Terrace
- 26 Afton Terrace
- 21 Braeburn Ln
- 23 Braeburn Ln
- 23 Braeburn Ln Unit 23
- 20 Afton Terrace
- 25 Braeburn Ln
- 25 Braeburn Ln Unit 25
- 19 Braeburn Ln
- 23 Afton Terrace
- 30 Afton Terrace
- 25 Afton Terrace
- 19 Afton Terrace
- 17 Braeburn Ln
- 27 Braeburn Ln
- 32 Afton Terrace
- 15 Braeburn Ln
- 29 Braeburn Ln
- 18 Afton Terrace
- 18 Braeburn Ln