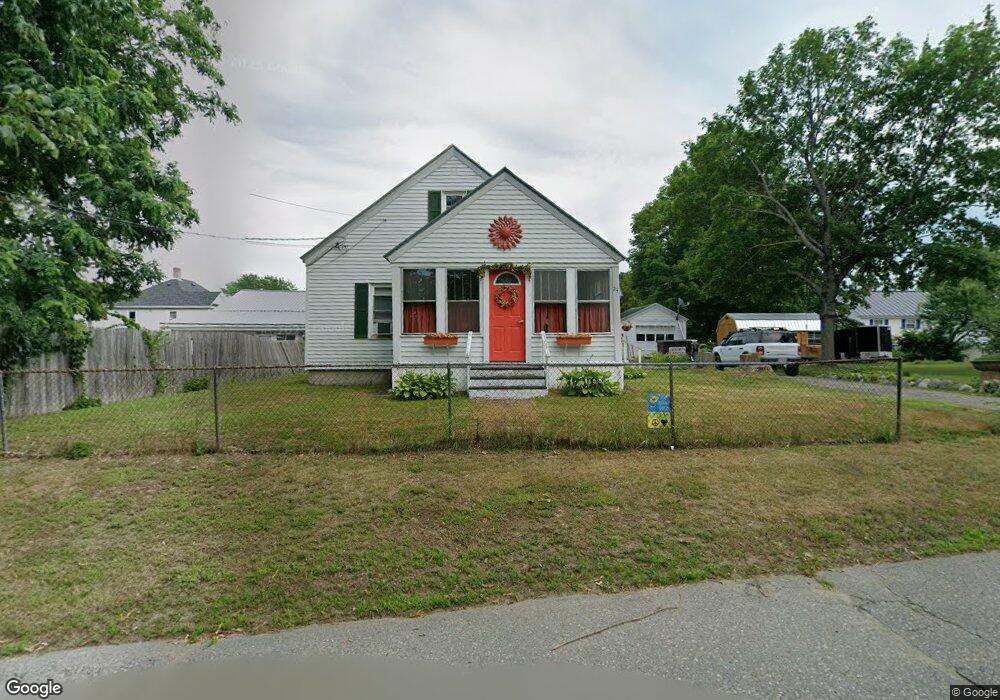
24 Ann St Waterville, ME 04901
Estimated Value: $187,000 - $232,098
3
Beds
2
Baths
1,310
Sq Ft
$160/Sq Ft
Est. Value
About This Home
This home is located at 24 Ann St, Waterville, ME 04901 and is currently estimated at $209,275, approximately $159 per square foot. 24 Ann St is a home located in Kennebec County with nearby schools including George J. Mitchell School, Albert S. Hall School, and Waterville Junior High School.
Ownership History
Date
Name
Owned For
Owner Type
Purchase Details
Closed on
Mar 6, 2024
Sold by
Hill Susanne
Bought by
Paquette Kelly A and Webber Charles S
Current Estimated Value
Purchase Details
Closed on
Aug 15, 2018
Sold by
Hill Marguerite A and Hill Susanne B
Bought by
Hill Susanne and Hill Marguerite A
Home Financials for this Owner
Home Financials are based on the most recent Mortgage that was taken out on this home.
Original Mortgage
$165,000
Interest Rate
4.98%
Mortgage Type
FHA
Create a Home Valuation Report for This Property
The Home Valuation Report is an in-depth analysis detailing your home's value as well as a comparison with similar homes in the area
Home Values in the Area
Average Home Value in this Area
Purchase History
| Date | Buyer | Sale Price | Title Company |
|---|---|---|---|
| Paquette Kelly A | $100,000 | None Available | |
| Hill Susanne | -- | -- |
Source: Public Records
Mortgage History
| Date | Status | Borrower | Loan Amount |
|---|---|---|---|
| Previous Owner | Hill Susanne | $165,000 |
Source: Public Records
Tax History Compared to Growth
Tax History
| Year | Tax Paid | Tax Assessment Tax Assessment Total Assessment is a certain percentage of the fair market value that is determined by local assessors to be the total taxable value of land and additions on the property. | Land | Improvement |
|---|---|---|---|---|
| 2025 | $3,609 | $212,300 | $20,900 | $191,400 |
| 2024 | $3,312 | $165,600 | $16,000 | $149,600 |
| 2023 | $3,295 | $165,600 | $16,000 | $149,600 |
| 2022 | $2,673 | $103,400 | $12,100 | $91,300 |
| 2021 | $2,637 | $103,400 | $12,100 | $91,300 |
| 2020 | $2,664 | $103,400 | $12,100 | $91,300 |
| 2019 | $2,664 | $103,400 | $12,100 | $91,300 |
| 2018 | $2,613 | $103,400 | $12,100 | $91,300 |
| 2017 | $2,412 | $103,400 | $12,100 | $91,300 |
| 2016 | $2,358 | $103,400 | $12,100 | $91,300 |
| 2015 | $2,166 | $77,900 | $18,500 | $59,400 |
| 2014 | $2,134 | $77,900 | $18,500 | $59,400 |
| 2013 | $2,134 | $77,900 | $18,500 | $59,400 |
Source: Public Records
Map
Nearby Homes