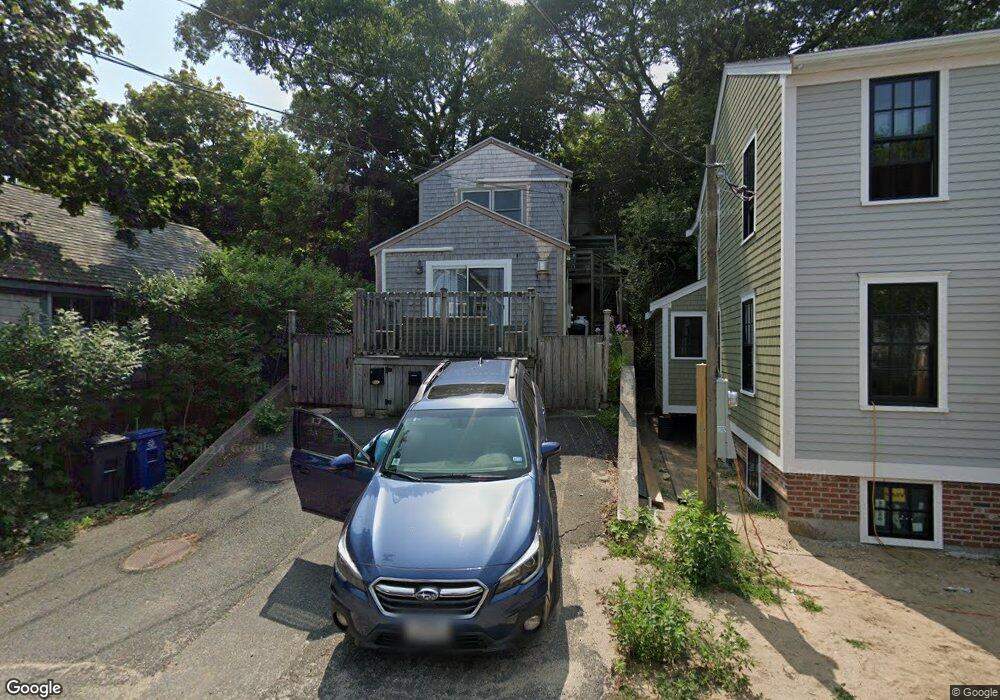
24 Bangs St Unit 3 Provincetown, MA 02657
Estimated Value: $563,614 - $713,000
1
Bed
1
Bath
382
Sq Ft
$1,663/Sq Ft
Est. Value
About This Home
This home is located at 24 Bangs St Unit 3, Provincetown, MA 02657 and is currently estimated at $635,404, approximately $1,663 per square foot. 24 Bangs St Unit 3 is a home located in Barnstable County with nearby schools including Provincetown Schools.
Ownership History
Date
Name
Owned For
Owner Type
Purchase Details
Closed on
Jul 11, 2023
Sold by
Hurn Marcus B J Est and Stewart
Bought by
Marcus B J Hurn T B and Marcus Stewart
Current Estimated Value
Purchase Details
Closed on
Oct 12, 2007
Sold by
Raymond Edward
Bought by
Hurn Marcus
Home Financials for this Owner
Home Financials are based on the most recent Mortgage that was taken out on this home.
Original Mortgage
$196,000
Interest Rate
6.49%
Mortgage Type
Purchase Money Mortgage
Purchase Details
Closed on
May 21, 2001
Sold by
Shupack Nancy
Bought by
Hadi Toni Sachs
Purchase Details
Closed on
Feb 12, 1996
Sold by
Brown William F
Bought by
Hadi Toni Sachs and Shupack Nancy
Purchase Details
Closed on
Aug 9, 1991
Sold by
Hillside Three Rt
Bought by
Brown William F
Create a Home Valuation Report for This Property
The Home Valuation Report is an in-depth analysis detailing your home's value as well as a comparison with similar homes in the area
Home Values in the Area
Average Home Value in this Area
Purchase History
| Date | Buyer | Sale Price | Title Company |
|---|---|---|---|
| Marcus B J Hurn T B | -- | None Available | |
| Marcus B J Hurn T B | -- | None Available | |
| Hurn Marcus | $245,000 | -- | |
| Hurn Marcus | $245,000 | -- | |
| Hadi Toni Sachs | $15,000 | -- | |
| Hadi Toni Sachs | $65,500 | -- | |
| Hadi Toni Sachs | $65,500 | -- | |
| Brown William F | $56,000 | -- | |
| Brown William F | $56,000 | -- |
Source: Public Records
Mortgage History
| Date | Status | Borrower | Loan Amount |
|---|---|---|---|
| Previous Owner | Brown William F | $185,450 | |
| Previous Owner | Hurn Marcus | $196,000 |
Source: Public Records
Tax History
| Year | Tax Paid | Tax Assessment Tax Assessment Total Assessment is a certain percentage of the fair market value that is determined by local assessors to be the total taxable value of land and additions on the property. | Land | Improvement |
|---|---|---|---|---|
| 2025 | $2,790 | $498,200 | $0 | $498,200 |
| 2024 | $2,623 | $470,100 | $0 | $470,100 |
| 2023 | $2,078 | $347,500 | $0 | $347,500 |
| 2022 | $2,182 | $327,600 | $0 | $327,600 |
| 2021 | $2,132 | $301,100 | $0 | $301,100 |
| 2020 | $1,934 | $292,200 | $0 | $292,200 |
| 2019 | $1,992 | $282,100 | $0 | $282,100 |
| 2018 | $1,876 | $251,800 | $0 | $251,800 |
| 2017 | $1,867 | $242,100 | $0 | $242,100 |
| 2016 | $1,825 | $234,000 | $0 | $234,000 |
| 2015 | $1,644 | $222,800 | $0 | $222,800 |
Source: Public Records
Map
Nearby Homes
- 184 Bradford St Unit 1
- 441 Commercial St Unit B
- 208 Bradford St Unit 7
- 488 Commercial St Unit 14
- 37 Pearl St
- 495 Commercial St Unit 9
- 495 Commercial St Unit 11
- 405 Commercial St Unit 5
- 9A Conwell St Unit 4
- 86 Harry Kemp Way Unit B
- 16 Conwell St Unit 3
- 16 Off Conwell St
- 361b Commercial St Unit U3
- 286A Bradford St Unit 5
- 33 Conwell St Unit 5B
- 535 Commercial St Unit 2
- 535 Commercial St Unit 2
- 539 Commercial St Unit 1
- 539 Commercial St Unit 3
- 333 Commercial St Unit 9
- 24 Bangs St Unit 2
- 24 Bangs St Unit 1
- 26 Bangs St
- 22 Bangs St
- 22 Bangs St Unit 1 & 2
- 26-A Bangs St
- 20 Bangs St
- 25 Bangs St Unit 2
- 25 Bangs St Unit 1
- 25 Bangs St
- 6 Upper Miller Hill Rd
- 21-A Bangs St
- 30 Bangs St Unit E
- 30 Bangs St Unit D
- 30 Bangs St Unit C
- 30 Bangs St Unit B
- 30 Bangs St Unit F
- 30 Bangs St Unit A
- 30 Bangs St Unit UF
- 30 Bangs St Unit G
Your Personal Tour Guide
Ask me questions while you tour the home.