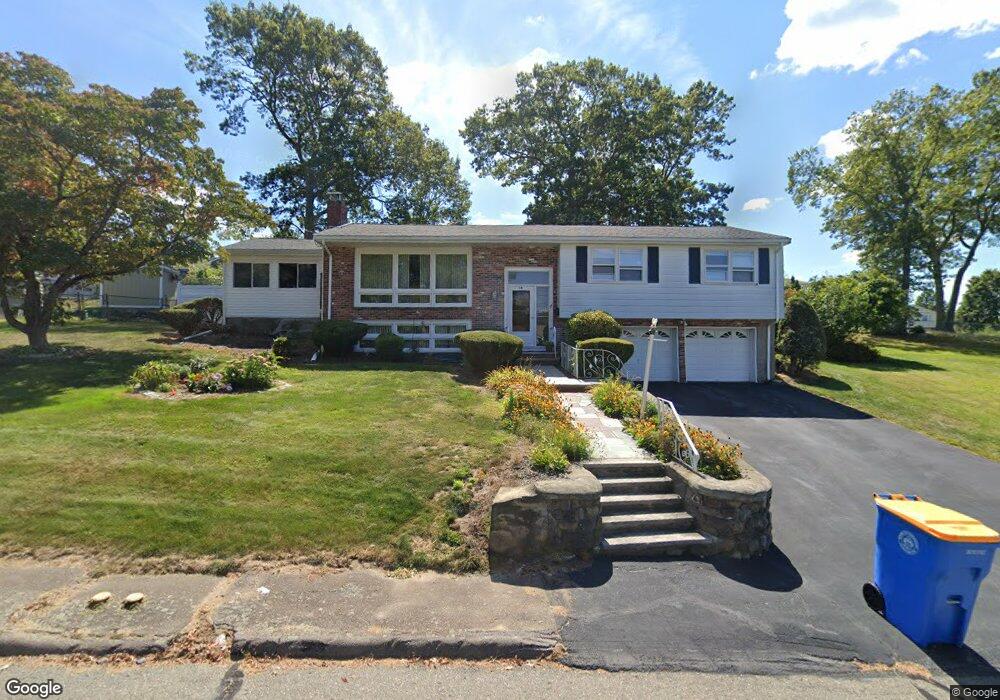
24 Barry St Randolph, MA 02368
North Randolph NeighborhoodEstimated Value: $621,000 - $668,000
3
Beds
2
Baths
1,248
Sq Ft
$517/Sq Ft
Est. Value
About This Home
This home is located at 24 Barry St, Randolph, MA 02368 and is currently estimated at $644,998, approximately $516 per square foot. 24 Barry St is a home located in Norfolk County with nearby schools including Randolph High School and Thacher Montessori School.
Ownership History
Date
Name
Owned For
Owner Type
Purchase Details
Closed on
Mar 21, 2011
Sold by
Johnson Bobbie J
Bought by
Johnson T
Current Estimated Value
Purchase Details
Closed on
Nov 2, 1998
Sold by
Simmons Elizabeth A and Mulligan Edith E
Bought by
Carson Helen M and Carson Helen T
Home Financials for this Owner
Home Financials are based on the most recent Mortgage that was taken out on this home.
Original Mortgage
$238,200
Interest Rate
6.68%
Mortgage Type
Purchase Money Mortgage
Purchase Details
Closed on
Jun 24, 1994
Sold by
Rizzo Ex Anthony M and Rizzo Ex Richard J
Bought by
Mulligan Leslie and Mulligan Edith E
Home Financials for this Owner
Home Financials are based on the most recent Mortgage that was taken out on this home.
Original Mortgage
$45,000
Interest Rate
8.74%
Mortgage Type
Purchase Money Mortgage
Create a Home Valuation Report for This Property
The Home Valuation Report is an in-depth analysis detailing your home's value as well as a comparison with similar homes in the area
Home Values in the Area
Average Home Value in this Area
Purchase History
| Date | Buyer | Sale Price | Title Company |
|---|---|---|---|
| Johnson T | -- | -- | |
| Carson Helen M | $265,000 | -- | |
| Mulligan Leslie | $145,000 | -- |
Source: Public Records
Mortgage History
| Date | Status | Borrower | Loan Amount |
|---|---|---|---|
| Previous Owner | Carson Helen M | $238,200 | |
| Previous Owner | Mulligan Leslie | $45,000 |
Source: Public Records
Tax History Compared to Growth
Tax History
| Year | Tax Paid | Tax Assessment Tax Assessment Total Assessment is a certain percentage of the fair market value that is determined by local assessors to be the total taxable value of land and additions on the property. | Land | Improvement |
|---|---|---|---|---|
| 2025 | $6,374 | $549,000 | $253,300 | $295,700 |
| 2024 | $6,244 | $545,300 | $248,400 | $296,900 |
| 2023 | $5,916 | $489,700 | $225,800 | $263,900 |
| 2022 | $5,683 | $417,900 | $188,200 | $229,700 |
| 2021 | $5,449 | $368,700 | $156,800 | $211,900 |
| 2020 | $5,306 | $355,900 | $156,800 | $199,100 |
| 2019 | $5,219 | $348,400 | $149,300 | $199,100 |
| 2018 | $5,155 | $324,600 | $135,700 | $188,900 |
| 2017 | $4,786 | $295,800 | $129,200 | $166,600 |
| 2016 | $4,654 | $267,600 | $117,600 | $150,000 |
| 2015 | $4,695 | $259,400 | $111,800 | $147,600 |
Source: Public Records
Map
Nearby Homes
- 6 Sunset Dr
- 902 Irving Rd Unit 902
- 232 Canton St Unit 104
- 10 Michael Rd
- 33 Michael Rd
- 304 High St
- 51 Himoor Cir
- 79 Gold St
- 26 Pauline St
- 23 Old St
- 9 Royal Crest Dr Unit 12
- 2 Smith Rd
- 43 Emily Jeffers Rd
- 12 Webster St
- 20 Simmonds Blvd Unit 20
- 18 Simmonds Blvd Unit 18
- 8 Simmonds Blvd Unit 8
- 22 Simmonds Blvd Unit 22
- 10 Simmonds Blvd Unit 10
- 24 Simmonds Blvd Unit 24