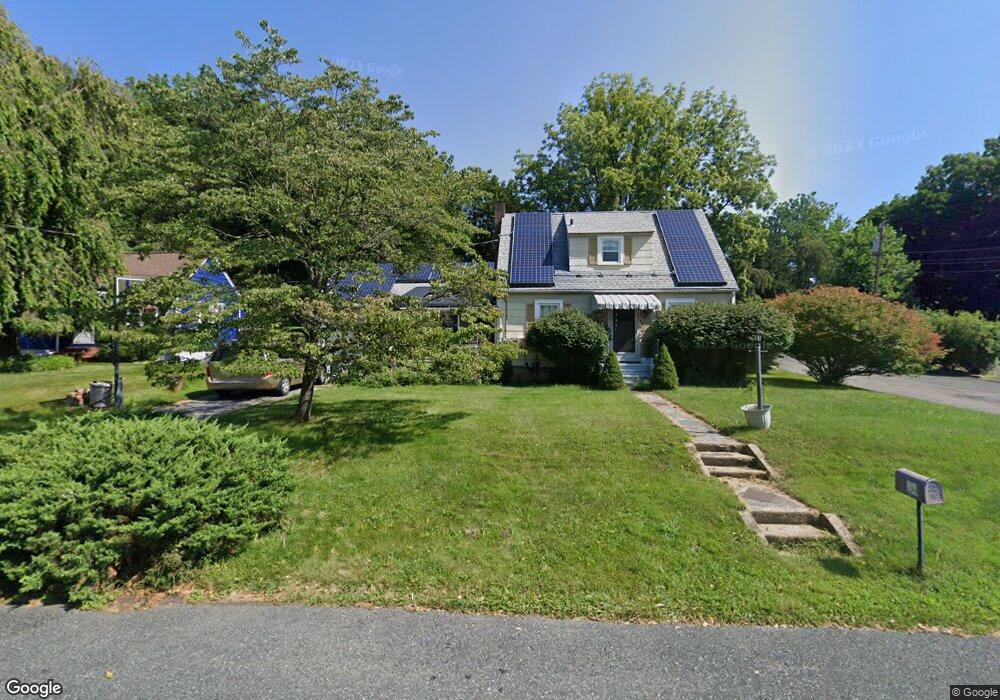
24 Beavers St High Bridge, NJ 08829
Estimated Value: $345,000 - $457,000
Studio
--
Bath
1,386
Sq Ft
$291/Sq Ft
Est. Value
About This Home
This home is located at 24 Beavers St, High Bridge, NJ 08829 and is currently estimated at $402,899, approximately $290 per square foot. 24 Beavers St is a home located in Hunterdon County with nearby schools including High Bridge Elementary School, High Bridge Middle School, and Voorhees High School.
Ownership History
Date
Name
Owned For
Owner Type
Purchase Details
Closed on
Aug 22, 2002
Sold by
Carlson Jonathan E
Bought by
Judd Gorden E and Judd Kimberly A
Current Estimated Value
Purchase Details
Closed on
Jan 4, 1997
Sold by
Kramer Frank Robert and Kramer Frank R
Bought by
Carlson Jonathan E and Carlson Tammy A
Home Financials for this Owner
Home Financials are based on the most recent Mortgage that was taken out on this home.
Original Mortgage
$130,625
Interest Rate
7.5%
Create a Home Valuation Report for This Property
The Home Valuation Report is an in-depth analysis detailing your home's value as well as a comparison with similar homes in the area
Home Values in the Area
Average Home Value in this Area
Purchase History
| Date | Buyer | Sale Price | Title Company |
|---|---|---|---|
| Judd Gorden E | $230,000 | -- | |
| Carlson Jonathan E | $137,500 | -- |
Source: Public Records
Mortgage History
| Date | Status | Borrower | Loan Amount |
|---|---|---|---|
| Previous Owner | Carlson Jonathan E | $130,625 |
Source: Public Records
Tax History
| Year | Tax Paid | Tax Assessment Tax Assessment Total Assessment is a certain percentage of the fair market value that is determined by local assessors to be the total taxable value of land and additions on the property. | Land | Improvement |
|---|---|---|---|---|
| 2025 | $11,956 | $312,000 | $182,300 | $129,700 |
| 2024 | $10,794 | $366,300 | $144,000 | $222,300 |
Source: Public Records
Map
Nearby Homes
Your Personal Tour Guide
Ask me questions while you tour the home.