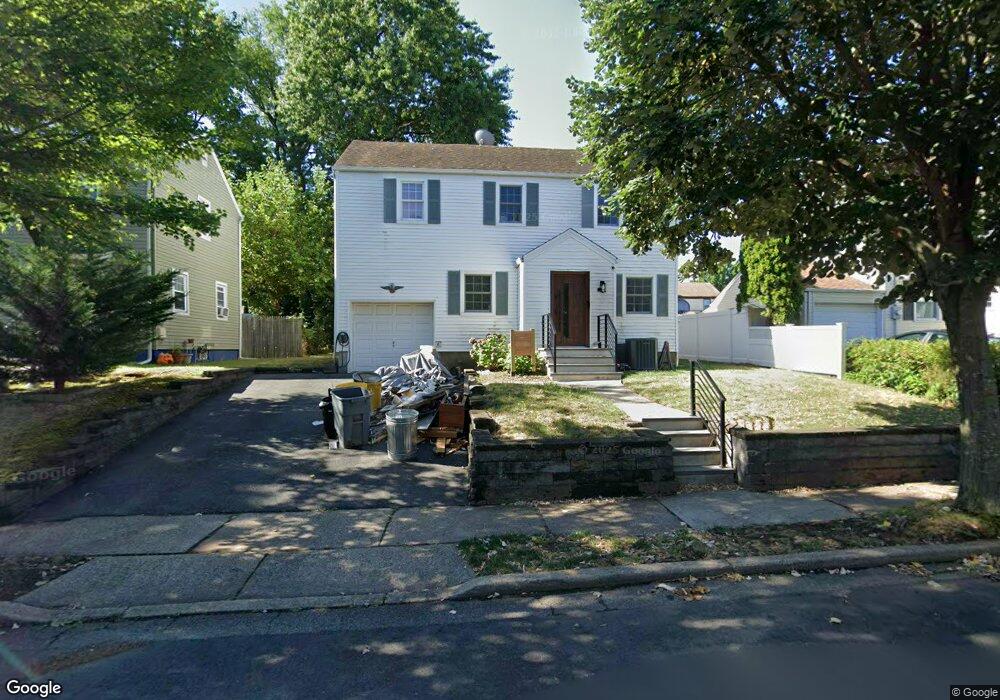
24 Blauvelt St Teaneck, NJ 07666
Estimated Value: $560,000 - $636,749
--
Bed
--
Bath
1,772
Sq Ft
$340/Sq Ft
Est. Value
About This Home
This home is located at 24 Blauvelt St, Teaneck, NJ 07666 and is currently estimated at $602,687, approximately $340 per square foot. 24 Blauvelt St is a home located in Bergen County with nearby schools including Teaneck Senior High School, Academy of Greatness & Excellence, and Bogota Middle School.
Ownership History
Date
Name
Owned For
Owner Type
Purchase Details
Closed on
Sep 18, 2024
Sold by
Tyll Edward T
Bought by
Lewis Reynoir R and Jacques Fauve E
Current Estimated Value
Home Financials for this Owner
Home Financials are based on the most recent Mortgage that was taken out on this home.
Original Mortgage
$424,000
Outstanding Balance
$419,225
Interest Rate
6.46%
Mortgage Type
New Conventional
Estimated Equity
$183,462
Purchase Details
Closed on
Nov 19, 2008
Create a Home Valuation Report for This Property
The Home Valuation Report is an in-depth analysis detailing your home's value as well as a comparison with similar homes in the area
Home Values in the Area
Average Home Value in this Area
Purchase History
| Date | Buyer | Sale Price | Title Company |
|---|---|---|---|
| Lewis Reynoir R | $530,000 | Title Bond Agency | |
| Lewis Reynoir R | $530,000 | Title Bond Agency | |
| -- | -- | -- |
Source: Public Records
Mortgage History
| Date | Status | Borrower | Loan Amount |
|---|---|---|---|
| Open | Lewis Reynoir R | $424,000 | |
| Closed | Lewis Reynoir R | $424,000 |
Source: Public Records
Tax History Compared to Growth
Tax History
| Year | Tax Paid | Tax Assessment Tax Assessment Total Assessment is a certain percentage of the fair market value that is determined by local assessors to be the total taxable value of land and additions on the property. | Land | Improvement |
|---|---|---|---|---|
| 2025 | $11,095 | $508,000 | $265,000 | $243,000 |
| 2024 | $9,995 | $508,000 | $265,000 | $243,000 |
| 2023 | $9,798 | $302,700 | $172,500 | $130,200 |
| 2022 | $9,798 | $302,700 | $172,500 | $130,200 |
| 2021 | $9,856 | $302,700 | $172,500 | $130,200 |
| 2020 | $9,789 | $302,700 | $172,500 | $130,200 |
| 2019 | $9,677 | $302,700 | $172,500 | $130,200 |
| 2018 | $9,605 | $302,700 | $172,500 | $130,200 |
| 2017 | $9,514 | $302,700 | $172,500 | $130,200 |
| 2016 | $9,372 | $302,700 | $172,500 | $130,200 |
| 2015 | $9,223 | $302,700 | $172,500 | $130,200 |
| 2014 | $10,153 | $394,900 | $220,000 | $174,900 |
Source: Public Records
Map
Nearby Homes