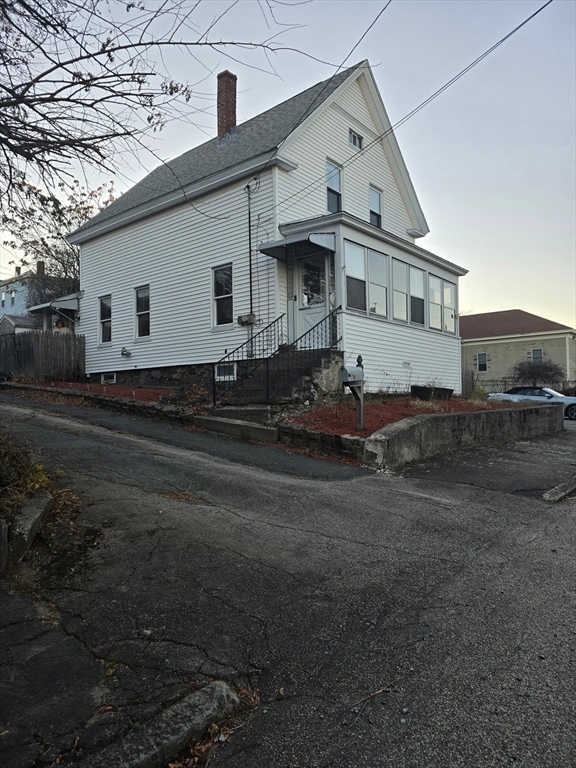
24 Boylston St Methuen, MA 01844
The East End NeighborhoodEstimated payment $2,463/month
Highlights
- Golf Course Community
- Custom Closet System
- Property is near public transit
- Medical Services
- Colonial Architecture
- Wood Flooring
About This Home
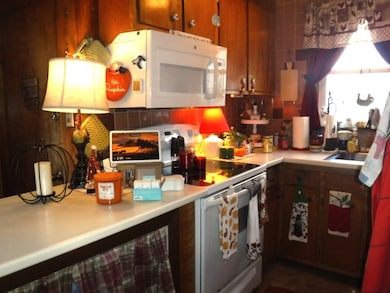
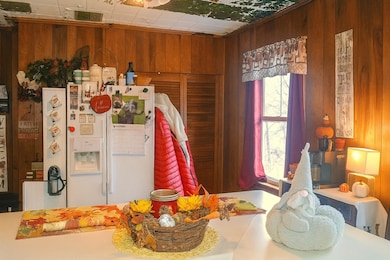
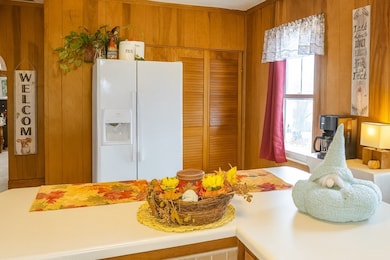
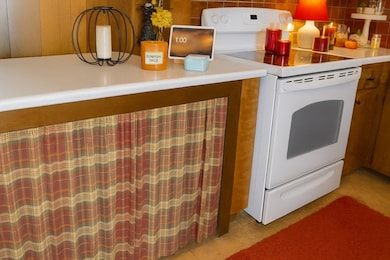
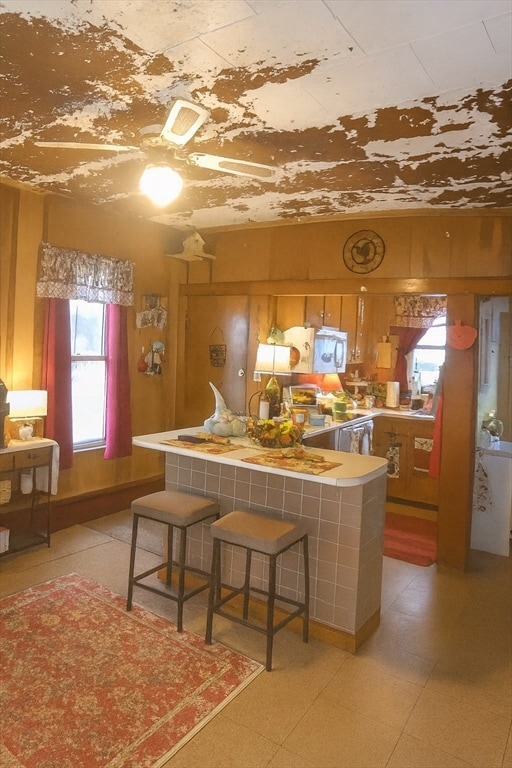
Welcome to this three-bedroom single-family home just waiting for your updates. Step inside to a comfortable and inviting floor plan featuring a large kitchen with copper ceiling that flows seamlessly into a formal dining room—ideal for gatherings and everyday living. The living room offers plenty of space to relax with built in book shelves overhead, and the hardwood floors throughout add warmth and character. Upstairs, you’ll find three well-proportioned bedrooms (one with a walk-in closet), providing privacy and comfort for all. Updated heating system offers peace of mind, and the property also includes two convenient storage sheds on a spacious double lot. Assessment, taxes, and lot size reflect the adjacent lot included in the sale (see attached deed).Showings begin at the open house on Sunday 12/7 from 11am - 1pm; 24-hour notice required for private appointments due to pets on the property.
Open House Schedule
-
Sunday, December 07, 202511:00 am to 1:00 pm12/7/2025 11:00:00 AM +00:0012/7/2025 1:00:00 PM +00:00Add to Calendar
Home Details
Home Type
- Single Family
Est. Annual Taxes
- $4,288
Year Built
- Built in 1900
Lot Details
- 10,002 Sq Ft Lot
- Level Lot
- Property is zoned MB
Home Design
- 966 Sq Ft Home
- Colonial Architecture
- Stone Foundation
- Frame Construction
- Shingle Roof
Kitchen
- Range
Flooring
- Wood
- Vinyl
Bedrooms and Bathrooms
- 3 Bedrooms
- Primary bedroom located on second floor
- Custom Closet System
- Walk-In Closet
Unfinished Basement
- Basement Fills Entire Space Under The House
- Block Basement Construction
- Laundry in Basement
Parking
- 5 Car Parking Spaces
- Driveway
- Paved Parking
- Open Parking
- Off-Street Parking
Outdoor Features
- Bulkhead
- Enclosed Patio or Porch
- Outdoor Storage
Location
- Property is near public transit
- Property is near schools
Schools
- Timony Elementary And Middle School
- Methuen High School
Utilities
- No Cooling
- Heating System Uses Natural Gas
- Heating System Uses Steam
- Gas Water Heater
Listing and Financial Details
- Legal Lot and Block 061-62 / 00105
- Assessor Parcel Number 2047779
Community Details
Overview
- No Home Owners Association
Amenities
- Medical Services
- Shops
Recreation
- Golf Course Community
- Park
Map
Home Values in the Area
Average Home Value in this Area
Tax History
| Year | Tax Paid | Tax Assessment Tax Assessment Total Assessment is a certain percentage of the fair market value that is determined by local assessors to be the total taxable value of land and additions on the property. | Land | Improvement |
|---|---|---|---|---|
| 2025 | $4,125 | $389,900 | $192,400 | $197,500 |
| 2024 | $4,051 | $373,000 | $175,500 | $197,500 |
| 2023 | $3,836 | $327,900 | $156,000 | $171,900 |
| 2022 | $3,689 | $282,700 | $130,000 | $152,700 |
| 2021 | $3,489 | $264,500 | $123,500 | $141,000 |
| 2020 | $3,477 | $258,700 | $123,500 | $135,200 |
| 2019 | $3,184 | $224,400 | $110,500 | $113,900 |
| 2018 | $3,128 | $219,200 | $110,500 | $108,700 |
| 2017 | $3,047 | $208,000 | $110,500 | $97,500 |
| 2016 | $2,984 | $201,500 | $104,000 | $97,500 |
| 2015 | $2,847 | $195,000 | $104,000 | $91,000 |
Property History
| Date | Event | Price | List to Sale | Price per Sq Ft |
|---|---|---|---|---|
| 12/03/2025 12/03/25 | For Sale | $399,900 | -- | $414 / Sq Ft |
Purchase History
| Date | Type | Sale Price | Title Company |
|---|---|---|---|
| Deed | $185,000 | -- | |
| Deed | $185,000 | -- | |
| Deed | -- | -- | |
| Deed | -- | -- | |
| Deed | -- | -- | |
| Deed | $140,000 | -- | |
| Deed | $140,000 | -- |
Mortgage History
| Date | Status | Loan Amount | Loan Type |
|---|---|---|---|
| Open | $182,141 | Purchase Money Mortgage | |
| Closed | $182,141 | Purchase Money Mortgage | |
| Previous Owner | $160,000 | Purchase Money Mortgage |
Source: MLS Property Information Network (MLS PIN)
MLS Number: 73459373
APN: METH-000914-000105-000061
Disclaimer: Certain information contained herein is derived from information provided by parties other than Homes.com. All information provided is deemed reliable, but is not guaranteed to be accurate and should be independently verified.
![]() The property listing data and information, or the Images, set forth herein were provided to MLS Property Information Network, Inc. from third party sources, including sellers, lessors and public records, and were compiled by MLS Property Information Network, Inc. The property listing data and information, and the Images, are for the personal, non-commercial use of consumers having a good faith interest in purchasing or leasing listed properties of the type displayed to them and may not be used for any purpose other than to identify prospective properties which such consumers may have a good faith interest in purchasing or leasing. MLS Property Information Network, Inc. and its subscribers disclaim any and all representations and warranties as to the accuracy of the property listing data and information, or as to the accuracy of any of the Images, set forth herein.
The property listing data and information, or the Images, set forth herein were provided to MLS Property Information Network, Inc. from third party sources, including sellers, lessors and public records, and were compiled by MLS Property Information Network, Inc. The property listing data and information, and the Images, are for the personal, non-commercial use of consumers having a good faith interest in purchasing or leasing listed properties of the type displayed to them and may not be used for any purpose other than to identify prospective properties which such consumers may have a good faith interest in purchasing or leasing. MLS Property Information Network, Inc. and its subscribers disclaim any and all representations and warranties as to the accuracy of the property listing data and information, or as to the accuracy of any of the Images, set forth herein.
- 9 Boylston St
- 35 Swan Ave
- 15 Swan Ave
- 24 Court St
- 48 Swan Ave
- 35 Kendall St
- 167 Ferry 53 Mann St Unit 2,5,6
- 20 Knox St Unit 43
- 20 Knox St Unit 23
- 68 Wesley St
- 63 Lippold St
- 106 Leroy Ave
- 29 Meadowbrook Rd
- 4 Alderbrook Ln
- 100-102 E Haverhill St
- 6 Longwood Dr
- 5 Harmony Ln
- 7 Magnolia Rd
- 65 Brook St
- 3 Thissell St
- 27-29 Vermont St Unit 2
- 117 Swan St Unit 2
- 157 Swan St Unit 2
- 16 Quincy St Unit 1
- 171 East St
- 38 Custer St
- 5 Harriman St Unit B
- 30 Linwood Ave Unit 2
- 3 Milk St Unit 2
- 8 Hall St
- 235 Jackson St Unit 2
- 16 Sargent St Unit 1
- 16 Sargent St Unit 2
- 53 Brook St Unit 3
- 162 Prospect St Unit 3rd Floor
- 37 Delmont St Unit 5
- 357 Howard St Unit 1
- 357 Howard St Unit 4
- 4 Moran Ct
- 575 Prospect St
