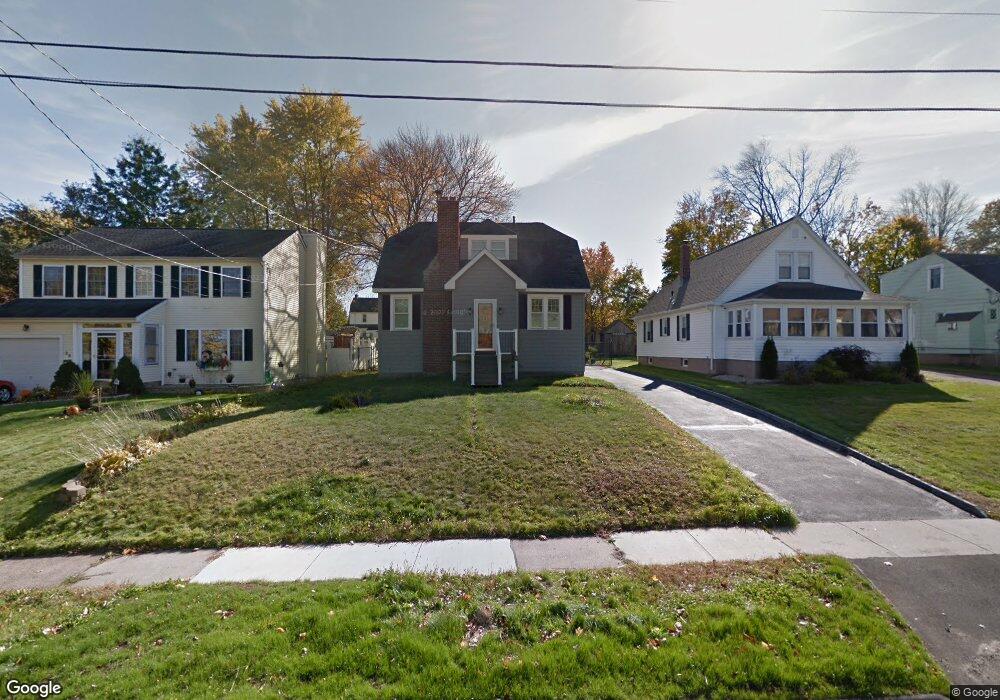
24 Byrd Rd Wethersfield, CT 06109
Estimated Value: $338,000 - $357,064
2
Beds
1
Bath
1,340
Sq Ft
$256/Sq Ft
Est. Value
About This Home
This home is located at 24 Byrd Rd, Wethersfield, CT 06109 and is currently estimated at $343,516, approximately $256 per square foot. 24 Byrd Rd is a home located in Hartford County with nearby schools including Alfred W. Hanmer School, Silas Deane Middle School, and Wethersfield High School.
Ownership History
Date
Name
Owned For
Owner Type
Purchase Details
Closed on
Feb 19, 2002
Sold by
Est Flint Lucy E and Reader David W
Bought by
Leamy Shawn A
Current Estimated Value
Home Financials for this Owner
Home Financials are based on the most recent Mortgage that was taken out on this home.
Original Mortgage
$82,450
Interest Rate
7.14%
Purchase Details
Closed on
Jan 2, 2002
Sold by
Est Flint Lucy E and Reader David W
Bought by
Citino Frank and Citino Nancy
Home Financials for this Owner
Home Financials are based on the most recent Mortgage that was taken out on this home.
Original Mortgage
$82,450
Interest Rate
7.14%
Create a Home Valuation Report for This Property
The Home Valuation Report is an in-depth analysis detailing your home's value as well as a comparison with similar homes in the area
Home Values in the Area
Average Home Value in this Area
Purchase History
| Date | Buyer | Sale Price | Title Company |
|---|---|---|---|
| Leamy Shawn A | $85,000 | -- | |
| Citino Frank | $43,500 | -- |
Source: Public Records
Mortgage History
| Date | Status | Borrower | Loan Amount |
|---|---|---|---|
| Open | Citino Frank | $79,000 | |
| Closed | Citino Frank | $89,200 | |
| Closed | Citino Frank | $82,650 | |
| Closed | Citino Frank | $82,450 |
Source: Public Records
Tax History
| Year | Tax Paid | Tax Assessment Tax Assessment Total Assessment is a certain percentage of the fair market value that is determined by local assessors to be the total taxable value of land and additions on the property. | Land | Improvement |
|---|---|---|---|---|
| 2025 | $8,454 | $205,100 | $86,440 | $118,660 |
| 2024 | $6,384 | $147,700 | $65,100 | $82,600 |
| 2023 | $6,171 | $147,700 | $65,100 | $82,600 |
| 2022 | $6,068 | $147,700 | $65,100 | $82,600 |
| 2021 | $6,007 | $147,700 | $65,100 | $82,600 |
| 2020 | $6,120 | $150,400 | $65,110 | $85,290 |
| 2019 | $6,127 | $150,400 | $65,110 | $85,290 |
| 2018 | $6,093 | $149,400 | $62,000 | $87,400 |
| 2017 | $5,942 | $149,400 | $62,000 | $87,400 |
| 2016 | $5,758 | $149,400 | $62,000 | $87,400 |
| 2015 | $5,706 | $149,400 | $62,000 | $87,400 |
| 2014 | $5,489 | $149,400 | $62,000 | $87,400 |
Source: Public Records
Map
Nearby Homes
- 35 Stillwold Dr
- 108 Chamberlain Rd
- 131 Coleman Rd
- 91 Somerset St
- 147 Spring St
- 87 Somerset St
- 99 Maple St
- 750 Wolcott Hill Rd
- 158 Dix Rd
- 137 Dale Rd
- 38 Wheeler Rd
- 31 Ox Yoke Dr
- 1 Fernwood St
- 23 Hillcrest Ave
- 250 Edward St
- 317-319 Garden St
- 192 Wolcott Hill Rd
- 89 Merriman Rd
- 455 Brimfield Rd
- 11 Charter Rd
Your Personal Tour Guide
Ask me questions while you tour the home.