Estimated Value: $97,635 - $146,000
--
Bed
1
Bath
1,008
Sq Ft
$130/Sq Ft
Est. Value
About This Home
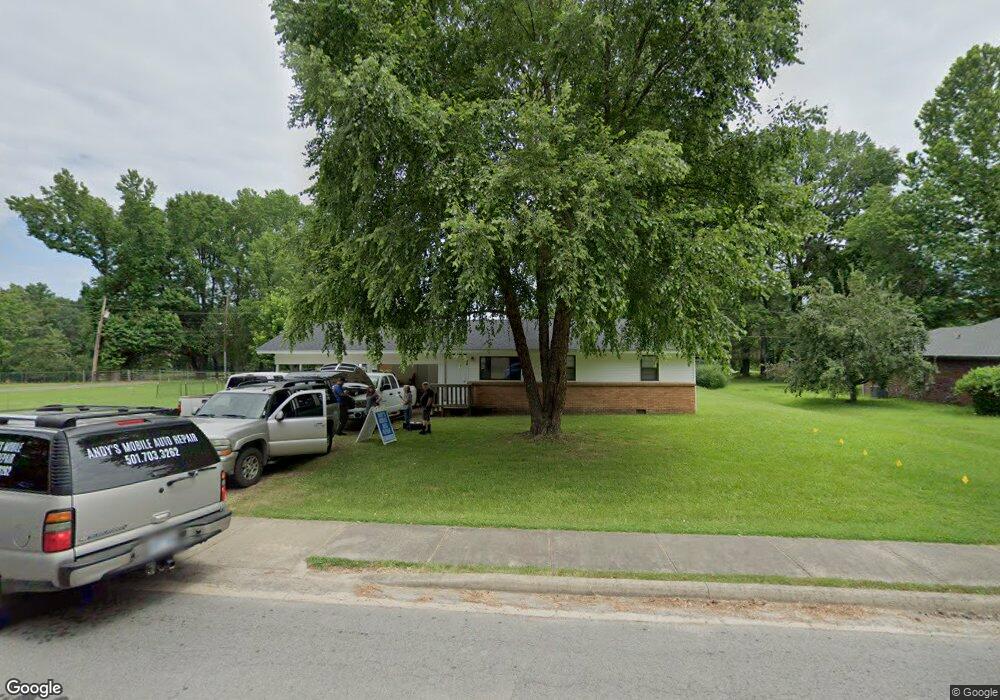
This home is located at 24 Campbell Dr, Cabot, AR 72023 and is currently estimated at $131,159, approximately $130 per square foot. 24 Campbell Dr is a home located in Lonoke County with nearby schools including Eastside Elementary School, Cabot Junior High North, and Cabot Middle School North.
Ownership History
Date
Name
Owned For
Owner Type
Purchase Details
Closed on
May 5, 2020
Sold by
Christensen L J L and Christensen Mildred J
Bought by
Christensen L J L and Christensen Mildred I
Current Estimated Value
Purchase Details
Closed on
Jul 8, 2014
Sold by
Betty F Betty F
Bought by
Christensen L and Christensen J.
Home Financials for this Owner
Home Financials are based on the most recent Mortgage that was taken out on this home.
Original Mortgage
$57,653
Outstanding Balance
$44,029
Interest Rate
4.23%
Mortgage Type
Purchase Money Mortgage
Estimated Equity
$87,130
Purchase Details
Closed on
Jun 25, 2001
Bought by
Moran
Purchase Details
Closed on
Sep 1, 2000
Bought by
Jeanne Beasley
Purchase Details
Closed on
Jun 18, 1991
Bought by
Beasley and Wife Jeanne
Purchase Details
Closed on
Sep 24, 1987
Bought by
Lowry
Purchase Details
Closed on
Sep 22, 1986
Bought by
Spence
Purchase Details
Closed on
Nov 23, 1981
Bought by
Byard
Purchase Details
Closed on
Oct 21, 1981
Bought by
Spence
Create a Home Valuation Report for This Property
The Home Valuation Report is an in-depth analysis detailing your home's value as well as a comparison with similar homes in the area
Home Values in the Area
Average Home Value in this Area
Purchase History
| Date | Buyer | Sale Price | Title Company |
|---|---|---|---|
| Christensen L J L | -- | None Available | |
| Christensen L | -- | -- | |
| Moran | -- | -- | |
| Jeanne Beasley | -- | -- | |
| Beasley | $36,000 | -- | |
| Beasley | $36,000 | -- | |
| Lowry | $18,500 | -- | |
| Spence | $13,000 | -- | |
| Byard | $27,000 | -- | |
| Spence | -- | -- |
Source: Public Records
Mortgage History
| Date | Status | Borrower | Loan Amount |
|---|---|---|---|
| Open | Christensen L | $57,653 |
Source: Public Records
Tax History Compared to Growth
Tax History
| Year | Tax Paid | Tax Assessment Tax Assessment Total Assessment is a certain percentage of the fair market value that is determined by local assessors to be the total taxable value of land and additions on the property. | Land | Improvement |
|---|---|---|---|---|
| 2025 | $137 | $12,080 | $1,730 | $10,350 |
| 2024 | $137 | $12,080 | $1,730 | $10,350 |
| 2023 | $137 | $12,080 | $1,730 | $10,350 |
| 2022 | $187 | $12,080 | $1,730 | $10,350 |
| 2021 | $187 | $12,080 | $1,730 | $10,350 |
| 2020 | $187 | $11,040 | $1,730 | $9,310 |
| 2019 | $187 | $11,040 | $1,730 | $9,310 |
| 2018 | $195 | $11,040 | $1,730 | $9,310 |
| 2017 | $507 | $11,040 | $1,730 | $9,310 |
| 2016 | $195 | $11,040 | $1,730 | $9,310 |
| 2015 | $519 | $11,310 | $1,730 | $9,580 |
| 2014 | $209 | $11,310 | $1,730 | $9,580 |
Source: Public Records
Map
Nearby Homes
- 13 Shenandoah Way
- 28 Shenandoah Way
- 1240 N Second St
- 07 Christian Ln
- 06 Christian Ln
- 306 Ray St
- 05 Christian Ln
- 15 Timberwood Dr
- 04 Christian Ln
- 42 Seminole Cir
- 03 Christian Ln
- 00 Christian Ln
- 01 Christian Ln
- 02 Christian Ln
- 14 White Eagle Cove
- 12 Bradford Dr
- 11 Bradford Dr
- 10 Bradford Dr
- 09 Bradford Dr
- 08 Bradford Dr