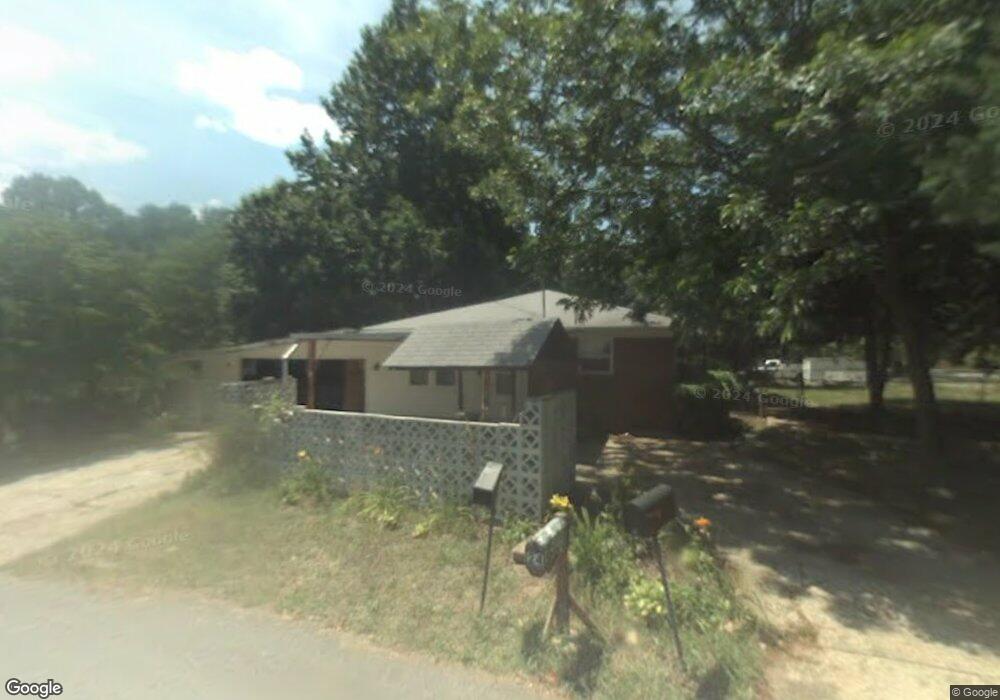
24 Cane Creek Valley Rd Unit 6 Dahlonega, GA 30533
Estimated Value: $320,000 - $368,000
3
Beds
2
Baths
1,512
Sq Ft
$227/Sq Ft
Est. Value
About This Home
This home is located at 24 Cane Creek Valley Rd Unit 6, Dahlonega, GA 30533 and is currently estimated at $343,971, approximately $227 per square foot. 24 Cane Creek Valley Rd Unit 6 is a home located in Lumpkin County with nearby schools including Clay County Middle School and Lumpkin County High School.
Ownership History
Date
Name
Owned For
Owner Type
Purchase Details
Closed on
May 9, 2022
Sold by
Hunt Isaiah
Bought by
Ryckman Wendy
Current Estimated Value
Home Financials for this Owner
Home Financials are based on the most recent Mortgage that was taken out on this home.
Original Mortgage
$266,000
Outstanding Balance
$250,714
Interest Rate
4.42%
Mortgage Type
New Conventional
Estimated Equity
$93,257
Purchase Details
Closed on
Jul 29, 2014
Sold by
Whonic Edward
Bought by
Hunt Isaiah and Fitzgerald Barbara
Home Financials for this Owner
Home Financials are based on the most recent Mortgage that was taken out on this home.
Original Mortgage
$72,000
Interest Rate
4.16%
Mortgage Type
New Conventional
Purchase Details
Closed on
Sep 7, 2000
Bought by
Larson Cullen C
Purchase Details
Closed on
Apr 8, 1992
Sold by
Whonic Gail D
Bought by
Whonic Gail D
Purchase Details
Closed on
Mar 1, 1991
Sold by
Larson Cullen C
Bought by
Jones Murl Sue
Create a Home Valuation Report for This Property
The Home Valuation Report is an in-depth analysis detailing your home's value as well as a comparison with similar homes in the area
Home Values in the Area
Average Home Value in this Area
Purchase History
| Date | Buyer | Sale Price | Title Company |
|---|---|---|---|
| Ryckman Wendy | $280,000 | -- | |
| Hunt Isaiah | $90,000 | -- | |
| Larson Cullen C | -- | -- | |
| Whonic Gail D | $62,500 | -- | |
| Jones Murl Sue | $62,000 | -- |
Source: Public Records
Mortgage History
| Date | Status | Borrower | Loan Amount |
|---|---|---|---|
| Open | Ryckman Wendy | $266,000 | |
| Previous Owner | Hunt Isaiah | $72,000 |
Source: Public Records
Tax History Compared to Growth
Tax History
| Year | Tax Paid | Tax Assessment Tax Assessment Total Assessment is a certain percentage of the fair market value that is determined by local assessors to be the total taxable value of land and additions on the property. | Land | Improvement |
|---|---|---|---|---|
| 2024 | $3,110 | $121,521 | $6,000 | $115,521 |
| 2023 | $2,174 | $113,493 | $6,000 | $107,493 |
| 2022 | $1,274 | $51,464 | $6,000 | $45,464 |
| 2021 | $1,105 | $43,164 | $6,000 | $37,164 |
| 2020 | $1,108 | $41,996 | $6,000 | $35,996 |
| 2019 | $1,118 | $41,996 | $6,000 | $35,996 |
| 2018 | $1,065 | $37,536 | $6,000 | $31,536 |
| 2017 | $1,068 | $36,912 | $6,000 | $30,912 |
| 2016 | $1,012 | $33,829 | $6,000 | $27,829 |
| 2015 | $916 | $33,829 | $6,000 | $27,829 |
| 2014 | $916 | $34,756 | $6,000 | $28,756 |
| 2013 | -- | $35,684 | $6,000 | $29,684 |
Source: Public Records
Map
Nearby Homes
- 0 Camp Wahsega Rd Unit 7600956
- 0 Camp Wahsega Rd Unit 10547292
- 357 Camp Wahsega Rd
- 181 Gilreath Way
- 22 Deer Ridge Rd
- 955 Camp Wahsega Rd
- 122 Tritt Rd
- 70 Avery Trail
- 77 Old River Rd
- 96 Elbert Gaddis Rd
- 98 Elbert Gaddis Rd
- 149 Highland Rd S
- 65 Golden Autumn Dr
- 97 Beaumont Dr
- 159 Misty Way
- 1202 Oak Grove Rd
- 238 Grand View St
- LOT 6 Sky Country Rd
- 64 Hickory Ln
- 24 Cane Creek Valley Rd
- 121 Camp Wahsega Rd
- 0 Wahsega Rd Unit 8391584
- 0 Wahsega Rd Unit 6021520
- 52 Cane Creek Valley Rd Unit 7
- 90 Camp Wahsega Rd
- 100 Camp Wahsega Rd
- 139 Camp Wahsega Rd
- 63 Cane Creek Valley Rd
- 130 Camp Wahsega Rd
- 70 Cane Creek Valley Rd Unit 8
- 70 Cane Creek Valley Rd
- 55 Cane Creek Valley Rd
- 75 Cane Creek Valley Rd Unit 15
- 75 Cane Creek Valley Rd
- 163 Camp Wahsega Rd
- 91 Cane Creek Valley Rd
- 11.31 Acres Camp Wahsega Rd
- 110 Cane Creek Valley Rd
- 99 Cane Creek Valley Rd