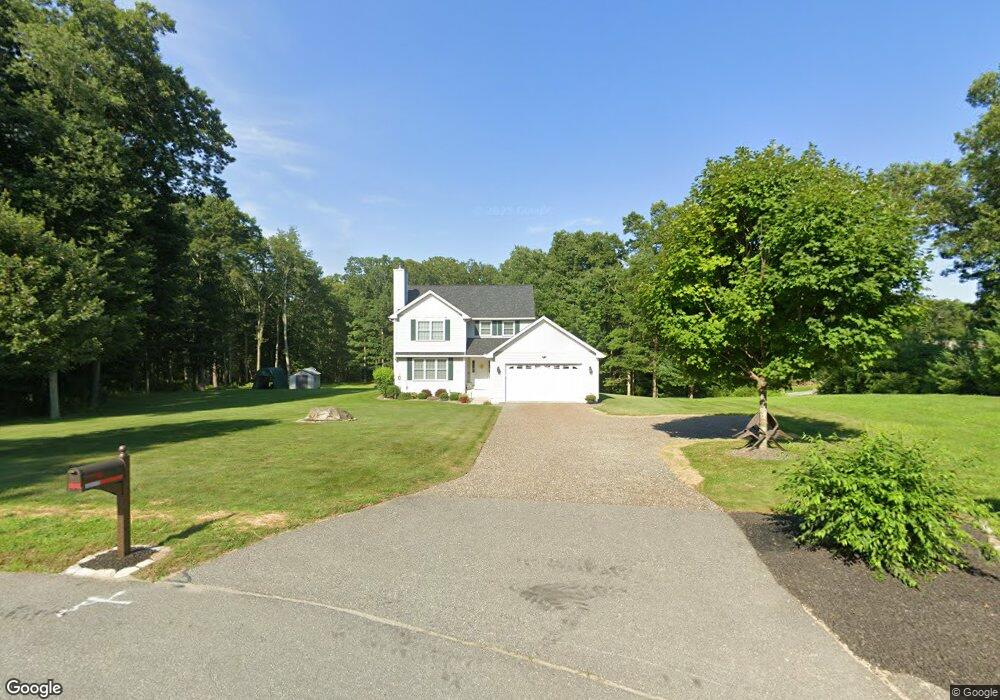
24 Cape Ave Danielson, CT 06239
Estimated Value: $368,714 - $397,000
3
Beds
3
Baths
1,360
Sq Ft
$283/Sq Ft
Est. Value
About This Home
This home is located at 24 Cape Ave, Danielson, CT 06239 and is currently estimated at $384,929, approximately $283 per square foot. 24 Cape Ave is a home located in Windham County with nearby schools including Killingly Central School, Killingly Memorial School, and Killingly Intermediate School.
Ownership History
Date
Name
Owned For
Owner Type
Purchase Details
Closed on
Mar 26, 2024
Sold by
Spellmon Peter T
Bought by
Debella Joseph M
Current Estimated Value
Home Financials for this Owner
Home Financials are based on the most recent Mortgage that was taken out on this home.
Original Mortgage
$297,000
Outstanding Balance
$292,469
Interest Rate
6.77%
Mortgage Type
Stand Alone Refi Refinance Of Original Loan
Estimated Equity
$92,460
Purchase Details
Closed on
Jul 1, 1993
Sold by
Danielson Fsla
Bought by
Spellman Peter T and Spellman Josephine
Purchase Details
Closed on
Aug 13, 1991
Sold by
Fgm Inv Co
Bought by
Benard Scott and Benard Tina
Create a Home Valuation Report for This Property
The Home Valuation Report is an in-depth analysis detailing your home's value as well as a comparison with similar homes in the area
Home Values in the Area
Average Home Value in this Area
Purchase History
| Date | Buyer | Sale Price | Title Company |
|---|---|---|---|
| Debella Joseph M | -- | None Available | |
| Debella Joseph M | -- | None Available | |
| Debella Joseph M | -- | None Available | |
| Spellman Peter T | $102,800 | -- | |
| Danielson Fsla | $102,800 | -- | |
| Benard Scott | $88,000 | -- | |
| Spellman Peter T | $102,800 | -- | |
| Benard Scott | $88,000 | -- |
Source: Public Records
Mortgage History
| Date | Status | Borrower | Loan Amount |
|---|---|---|---|
| Open | Debella Joseph M | $297,000 | |
| Closed | Debella Joseph M | $297,000 | |
| Previous Owner | Benard Scott | $108,271 | |
| Previous Owner | Benard Scott | $140,000 |
Source: Public Records
Tax History
| Year | Tax Paid | Tax Assessment Tax Assessment Total Assessment is a certain percentage of the fair market value that is determined by local assessors to be the total taxable value of land and additions on the property. | Land | Improvement |
|---|---|---|---|---|
| 2025 | $4,737 | $203,850 | $36,400 | $167,450 |
| 2024 | $4,372 | $197,760 | $36,400 | $161,360 |
| 2023 | $4,263 | $146,650 | $31,500 | $115,150 |
| 2022 | $4,008 | $146,650 | $31,500 | $115,150 |
| 2021 | $3,995 | $146,650 | $31,500 | $115,150 |
| 2020 | $3,921 | $146,650 | $31,500 | $115,150 |
| 2019 | $3,983 | $146,650 | $31,500 | $115,150 |
| 2017 | $3,517 | $122,500 | $24,500 | $98,000 |
| 2016 | $3,517 | $122,500 | $24,500 | $98,000 |
| 2015 | $3,517 | $122,500 | $24,500 | $98,000 |
| 2014 | $3,419 | $122,500 | $24,500 | $98,000 |
Source: Public Records
Map
Nearby Homes
- 175 Mashentuck Rd
- 64 Westcott Rd
- 85 Mashentuck Rd
- 380 Mashentuck Rd
- 102 Halls Hill Rd
- 23 Bailey Hill Village
- 395 Bailey Hill Rd
- 73 Hawkins St
- 724 Cook Hill Rd
- 150 Broad St
- 102 Cottage St
- 18 Broad St
- 24 Center St
- 10 Center St
- 55,94,100 Hubbard Hi Klocek Rd
- 85 Furnace St
- 61 Deerwood Dr
- 23 Melinda Terrace
- 43 Fall Brook Rd
- Lot 2 Klosek Rd
Your Personal Tour Guide
Ask me questions while you tour the home.