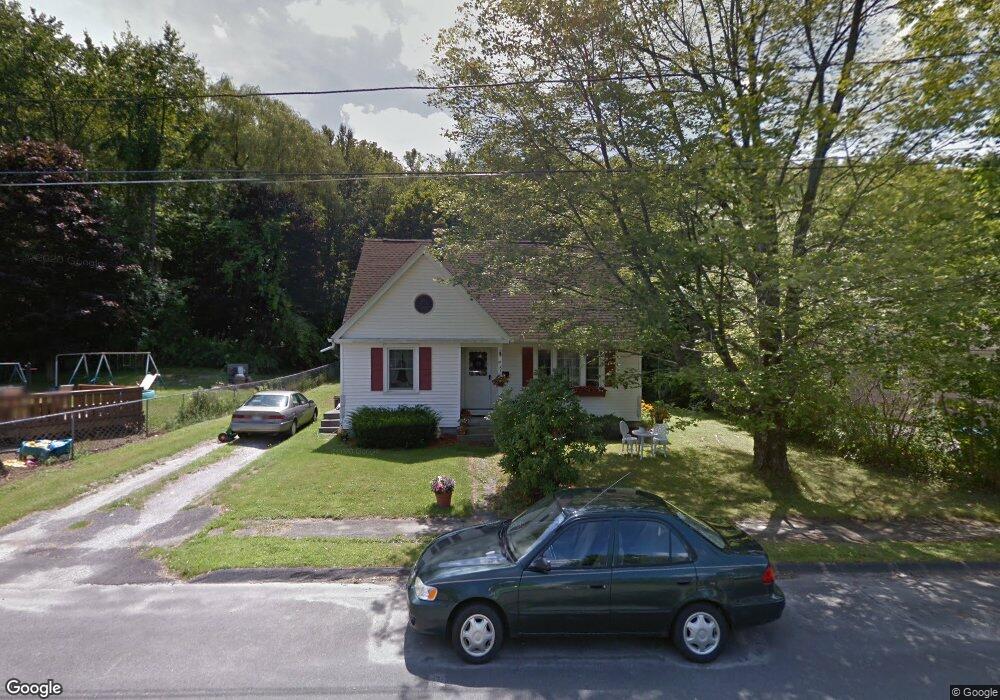
24 Catherine St North Adams, MA 01247
Estimated Value: $264,000 - $316,000
3
Beds
2
Baths
1,789
Sq Ft
$156/Sq Ft
Est. Value
About This Home
This home is located at 24 Catherine St, North Adams, MA 01247 and is currently estimated at $279,599, approximately $156 per square foot. 24 Catherine St is a home located in Berkshire County with nearby schools including Greylock Elementary School, Drury High School, and Pine Cobble School.
Ownership History
Date
Name
Owned For
Owner Type
Purchase Details
Closed on
Dec 11, 2019
Sold by
Andrews Felix R and Andrews Janice A
Bought by
Andrews Brad W and Andrews Aaron E
Current Estimated Value
Purchase Details
Closed on
Sep 26, 1985
Bought by
Andrews Felix R and Andrews Janice A
Create a Home Valuation Report for This Property
The Home Valuation Report is an in-depth analysis detailing your home's value as well as a comparison with similar homes in the area
Home Values in the Area
Average Home Value in this Area
Purchase History
| Date | Buyer | Sale Price | Title Company |
|---|---|---|---|
| Andrews Brad W | -- | None Available | |
| Andrews Brad W | -- | None Available | |
| Andrews Felix R | -- | -- |
Source: Public Records
Mortgage History
| Date | Status | Borrower | Loan Amount |
|---|---|---|---|
| Previous Owner | Andrews Felix R | $21,000 | |
| Previous Owner | Andrews Felix R | $80,000 | |
| Previous Owner | Andrews Felix R | $80,000 |
Source: Public Records
Tax History Compared to Growth
Tax History
| Year | Tax Paid | Tax Assessment Tax Assessment Total Assessment is a certain percentage of the fair market value that is determined by local assessors to be the total taxable value of land and additions on the property. | Land | Improvement |
|---|---|---|---|---|
| 2025 | $3,653 | $218,600 | $44,300 | $174,300 |
| 2024 | $3,428 | $200,000 | $40,500 | $159,500 |
| 2023 | $3,341 | $189,100 | $40,500 | $148,600 |
| 2022 | $3,044 | $164,300 | $40,500 | $123,800 |
| 2021 | $2,831 | $152,100 | $37,500 | $114,600 |
| 2020 | $2,635 | $141,500 | $37,300 | $104,200 |
| 2019 | $2,475 | $129,500 | $34,400 | $95,100 |
| 2018 | $2,380 | $129,500 | $36,200 | $93,300 |
| 2017 | $2,265 | $128,200 | $35,800 | $92,400 |
| 2016 | $2,198 | $126,400 | $35,800 | $90,600 |
| 2015 | $2,128 | $127,500 | $35,800 | $91,700 |
Source: Public Records
Map
Nearby Homes