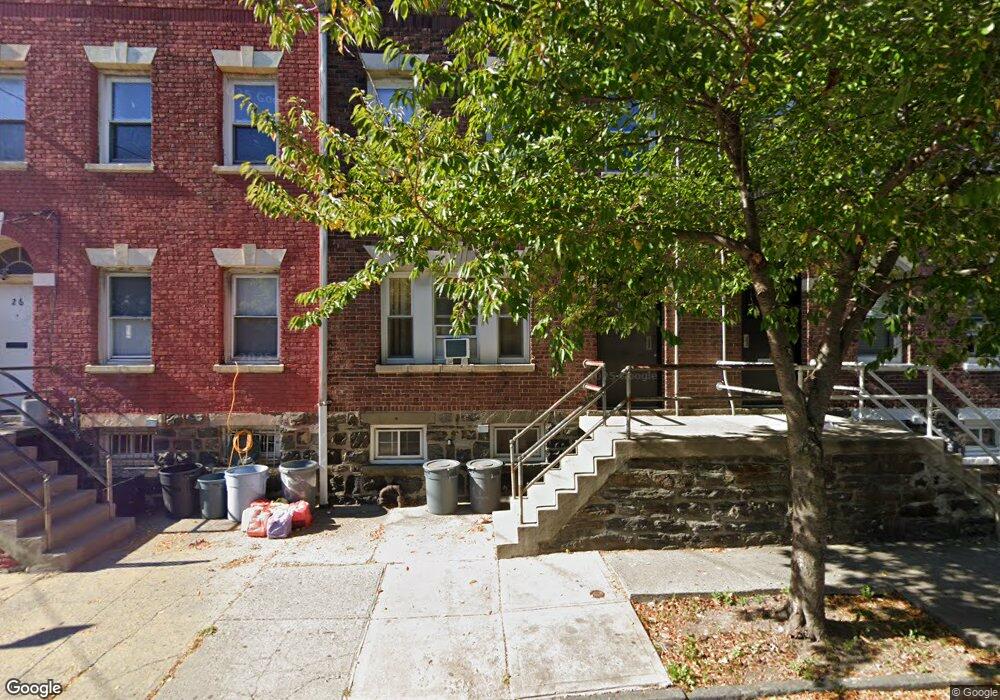
24 Cedar St Staten Island, NY 10304
Stapleton NeighborhoodEstimated Value: $571,470 - $659,000
4
Beds
2
Baths
1,840
Sq Ft
$333/Sq Ft
Est. Value
About This Home
This home is located at 24 Cedar St, Staten Island, NY 10304 and is currently estimated at $613,118, approximately $333 per square foot. 24 Cedar St is a home located in Richmond County with nearby schools including P.S. 78, P.S./I.S. 78Q Early Childhood Center, and I.S. 49 Berta A Dreyfus.
Ownership History
Date
Name
Owned For
Owner Type
Purchase Details
Closed on
May 17, 1996
Sold by
Colacino Robert J and Colacino Margaret Ann
Bought by
Quinn Richard L
Current Estimated Value
Home Financials for this Owner
Home Financials are based on the most recent Mortgage that was taken out on this home.
Original Mortgage
$96,000
Outstanding Balance
$5,425
Interest Rate
7.91%
Estimated Equity
$607,693
Create a Home Valuation Report for This Property
The Home Valuation Report is an in-depth analysis detailing your home's value as well as a comparison with similar homes in the area
Home Values in the Area
Average Home Value in this Area
Purchase History
| Date | Buyer | Sale Price | Title Company |
|---|---|---|---|
| Quinn Richard L | $120,000 | -- |
Source: Public Records
Mortgage History
| Date | Status | Borrower | Loan Amount |
|---|---|---|---|
| Open | Quinn Richard L | $96,000 |
Source: Public Records
Tax History
| Year | Tax Paid | Tax Assessment Tax Assessment Total Assessment is a certain percentage of the fair market value that is determined by local assessors to be the total taxable value of land and additions on the property. | Land | Improvement |
|---|---|---|---|---|
| 2025 | $3,296 | $32,520 | $2,631 | $29,889 |
| 2024 | $3,296 | $26,580 | $3,037 | $23,543 |
| 2023 | $3,144 | $15,480 | $2,570 | $12,910 |
| 2022 | $2,932 | $24,120 | $4,920 | $19,200 |
| 2021 | $3,091 | $19,980 | $4,920 | $15,060 |
| 2020 | $3,068 | $19,500 | $4,920 | $14,580 |
| 2019 | $2,860 | $18,120 | $4,920 | $13,200 |
| 2018 | $2,630 | $12,900 | $4,920 | $7,980 |
| 2017 | $2,495 | $12,240 | $4,920 | $7,320 |
| 2016 | $2,795 | $13,980 | $4,920 | $9,060 |
| 2015 | $2,579 | $14,230 | $3,825 | $10,405 |
| 2014 | $2,579 | $13,436 | $3,409 | $10,027 |
Source: Public Records
Map
Nearby Homes
Your Personal Tour Guide
Ask me questions while you tour the home.