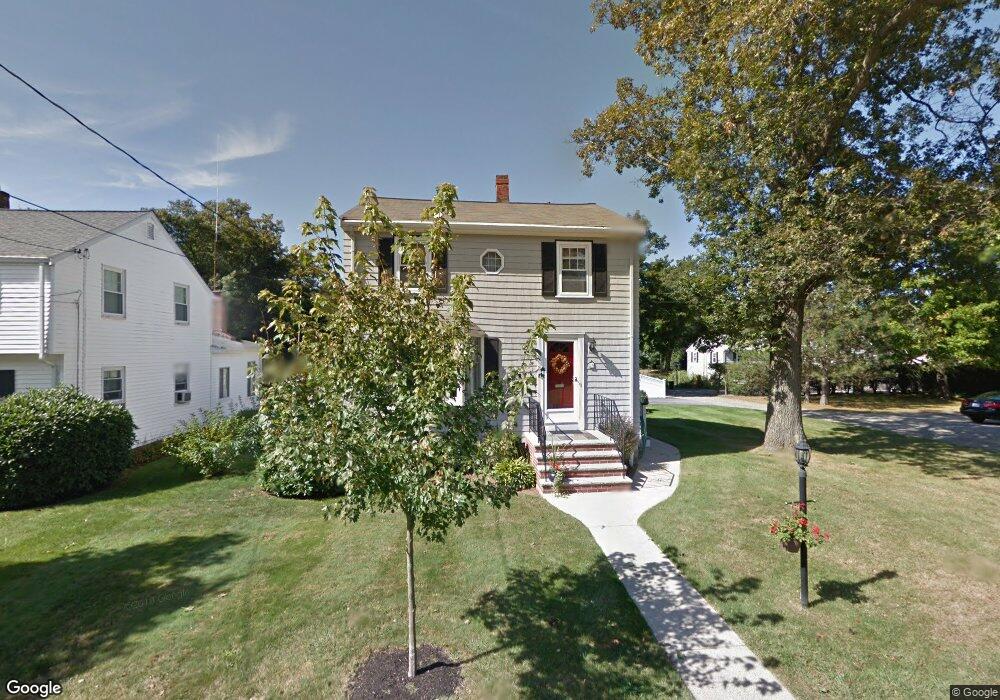
24 Cedarway Stoneham, MA 02180
Colonial Park NeighborhoodEstimated Value: $763,672 - $865,000
3
Beds
2
Baths
2,083
Sq Ft
$397/Sq Ft
Est. Value
About This Home
This home is located at 24 Cedarway, Stoneham, MA 02180 and is currently estimated at $826,918, approximately $396 per square foot. 24 Cedarway is a home located in Middlesex County with nearby schools including Stoneham High School, St. Patrick Elementary School, and Greater Boston Academy.
Ownership History
Date
Name
Owned For
Owner Type
Purchase Details
Closed on
Dec 31, 2015
Sold by
Robblee Joseph F and Robblee Nancy M
Bought by
Robblee Ft and Robblee Joseph F
Current Estimated Value
Purchase Details
Closed on
Jul 28, 1980
Bought by
Robblee Ft
Create a Home Valuation Report for This Property
The Home Valuation Report is an in-depth analysis detailing your home's value as well as a comparison with similar homes in the area
Home Values in the Area
Average Home Value in this Area
Purchase History
| Date | Buyer | Sale Price | Title Company |
|---|---|---|---|
| Robblee Ft | -- | -- | |
| Robblee Ft | -- | -- |
Source: Public Records
Mortgage History
| Date | Status | Borrower | Loan Amount |
|---|---|---|---|
| Previous Owner | Robblee Ft | $30,000 | |
| Previous Owner | Robblee Ft | $80,000 | |
| Previous Owner | Robblee Ft | $85,000 |
Source: Public Records
Tax History
| Year | Tax Paid | Tax Assessment Tax Assessment Total Assessment is a certain percentage of the fair market value that is determined by local assessors to be the total taxable value of land and additions on the property. | Land | Improvement |
|---|---|---|---|---|
| 2025 | $6,763 | $661,100 | $332,500 | $328,600 |
| 2024 | $6,463 | $610,300 | $306,300 | $304,000 |
| 2023 | $6,267 | $564,600 | $280,000 | $284,600 |
| 2022 | $5,281 | $507,300 | $253,800 | $253,500 |
| 2021 | $5,360 | $495,400 | $245,000 | $250,400 |
| 2020 | $5,200 | $481,900 | $229,500 | $252,400 |
| 2019 | $5,148 | $458,800 | $225,000 | $233,800 |
| 2018 | $4,875 | $416,300 | $195,500 | $220,800 |
| 2017 | $4,810 | $388,200 | $176,000 | $212,200 |
| 2016 | $4,696 | $369,800 | $176,000 | $193,800 |
| 2015 | $4,590 | $354,200 | $168,000 | $186,200 |
| 2014 | $4,577 | $339,300 | $160,000 | $179,300 |
Source: Public Records
Map
Nearby Homes
- 3 Veterans Ln
- 15 Brookbridge Rd
- 12 Lovis Ave
- 9 Lovis Ave
- 19 Fellsmere Ave
- 39 Tamarock Terrace
- 15 Hickory Hill Rd
- 81 Spring St
- 33 Lake Ave
- 762 Main St
- 17 Franklin St
- 159 Franklin St Unit D2
- 159 Franklin St Unit C2
- 159 Franklin St Unit E6
- 6 Sherman Rd
- 137 Franklin St Unit 102
- 21 Tremont St Unit B
- 21 Tremont St Unit A
- 24 Gladstone St
- 1 Sidney St