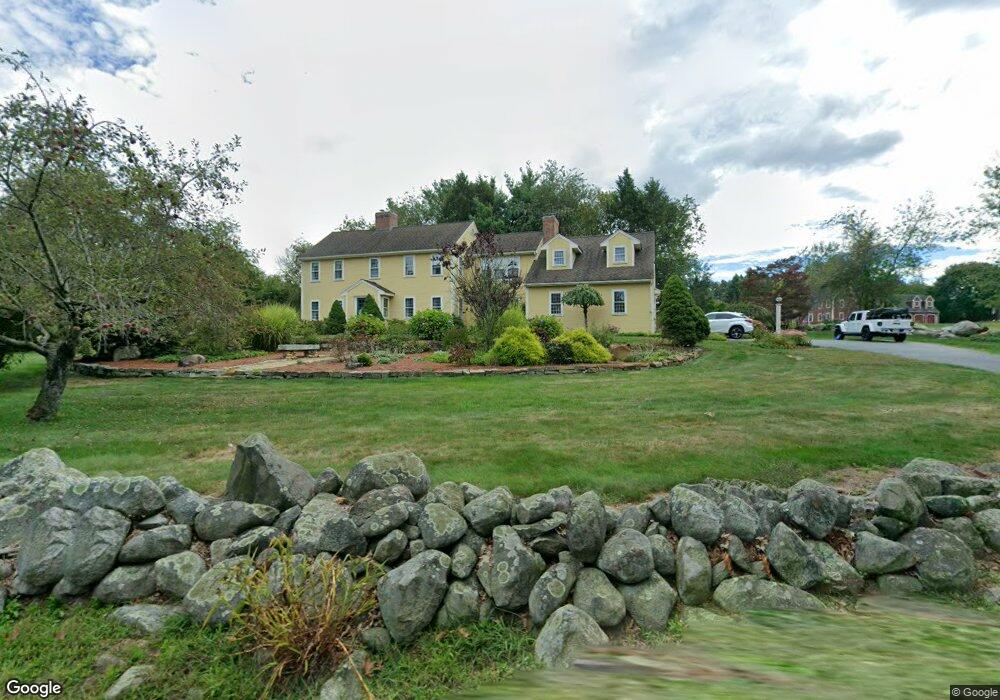
24 Chamberlain Rd Westford, MA 01886
Estimated Value: $1,247,260 - $1,480,000
4
Beds
3
Baths
3,000
Sq Ft
$461/Sq Ft
Est. Value
About This Home
This home is located at 24 Chamberlain Rd, Westford, MA 01886 and is currently estimated at $1,382,565, approximately $460 per square foot. 24 Chamberlain Rd is a home located in Middlesex County with nearby schools including Nabnasset Elementary, Abbot Elementary School, and Stony Brook School.
Ownership History
Date
Name
Owned For
Owner Type
Purchase Details
Closed on
Dec 27, 2001
Sold by
Gammon William D and Gamon Beverly J
Bought by
Dillon Craig C and Dillon Kathleen J
Current Estimated Value
Purchase Details
Closed on
Mar 2, 1999
Sold by
Gray Scott R and Gray Dana C
Bought by
Saulino Charles A and Saulino Angela
Purchase Details
Closed on
Dec 29, 1995
Sold by
Woodward Thomas M and Woodward Mary S
Bought by
Gammon William D and Gammon Beverly
Purchase Details
Closed on
Feb 27, 1989
Sold by
Watt William M
Bought by
Woodward Thomas M
Create a Home Valuation Report for This Property
The Home Valuation Report is an in-depth analysis detailing your home's value as well as a comparison with similar homes in the area
Home Values in the Area
Average Home Value in this Area
Purchase History
| Date | Buyer | Sale Price | Title Company |
|---|---|---|---|
| Dillon Craig C | $630,000 | -- | |
| Saulino Charles A | $210,000 | -- | |
| Gammon William D | $362,500 | -- | |
| Woodward Thomas M | $462,900 | -- |
Source: Public Records
Mortgage History
| Date | Status | Borrower | Loan Amount |
|---|---|---|---|
| Open | Woodward Thomas M | $175,000 | |
| Open | Woodward Thomas M | $350,000 |
Source: Public Records
Tax History
| Year | Tax Paid | Tax Assessment Tax Assessment Total Assessment is a certain percentage of the fair market value that is determined by local assessors to be the total taxable value of land and additions on the property. | Land | Improvement |
|---|---|---|---|---|
| 2025 | $16,510 | $1,225,700 | $347,000 | $878,700 |
| 2024 | $16,532 | $1,200,600 | $330,400 | $870,200 |
| 2023 | $15,548 | $1,053,400 | $314,500 | $738,900 |
| 2022 | $16,233 | $1,007,000 | $277,100 | $729,900 |
| 2021 | $0 | $860,000 | $277,100 | $582,900 |
| 2020 | $0 | $863,600 | $277,100 | $586,500 |
| 2019 | $13,695 | $827,000 | $277,100 | $549,900 |
| 2018 | $0 | $817,200 | $267,300 | $549,900 |
| 2017 | $12,641 | $770,300 | $267,300 | $503,000 |
| 2016 | $12,396 | $760,500 | $255,300 | $505,200 |
| 2015 | $12,224 | $752,700 | $247,200 | $505,500 |
| 2014 | $11,915 | $717,800 | $237,300 | $480,500 |
Source: Public Records
Map
Nearby Homes
Your Personal Tour Guide
Ask me questions while you tour the home.