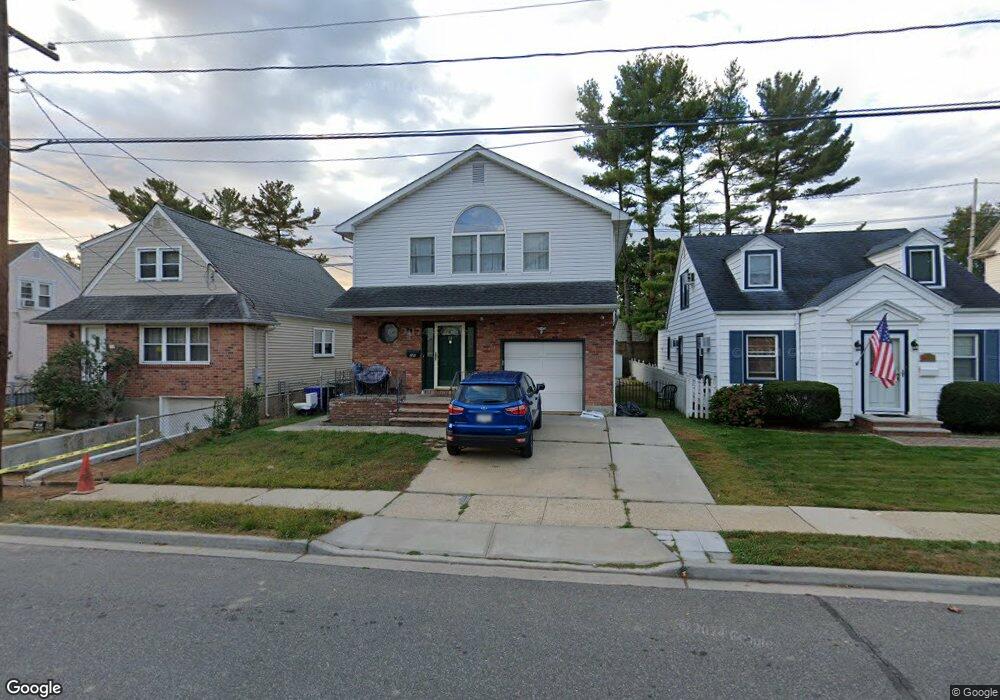
24 Charles St Unit 2nd FL Floral Park, NY 11001
Estimated Value: $916,120 - $951,000
3
Beds
1
Bath
1,059
Sq Ft
$882/Sq Ft
Est. Value
About This Home
This home is located at 24 Charles St Unit 2nd FL, Floral Park, NY 11001 and is currently estimated at $933,560, approximately $881 per square foot. 24 Charles St Unit 2nd FL is a home located in Nassau County with nearby schools including Our Lady Of Victory School.
Ownership History
Date
Name
Owned For
Owner Type
Purchase Details
Closed on
Feb 4, 2022
Sold by
Jiang Sulun and Jiang Huangzhen
Bought by
Jiang Sulun
Current Estimated Value
Purchase Details
Closed on
Dec 3, 2019
Sold by
Urbina Jose L and Urbina Shelley E
Bought by
Jiang Sulun and Jiang Huangzhen
Home Financials for this Owner
Home Financials are based on the most recent Mortgage that was taken out on this home.
Original Mortgage
$340,000
Outstanding Balance
$300,345
Interest Rate
3.7%
Mortgage Type
New Conventional
Estimated Equity
$633,215
Purchase Details
Closed on
Oct 17, 2018
Sold by
Urbina Shelley E
Bought by
Urbina Jose L and Urbina Shelley E
Purchase Details
Closed on
Nov 19, 2010
Sold by
Urbina Shelley E and Rodin Aaron
Bought by
Urbina Shelley E and Rodin Kenneth
Purchase Details
Closed on
Mar 14, 1997
Sold by
Casale Therea A
Bought by
Rodin Aaron
Create a Home Valuation Report for This Property
The Home Valuation Report is an in-depth analysis detailing your home's value as well as a comparison with similar homes in the area
Home Values in the Area
Average Home Value in this Area
Purchase History
| Date | Buyer | Sale Price | Title Company |
|---|---|---|---|
| Jiang Sulun | -- | Fidelity National Title | |
| Jiang Sulun | $660,000 | Fidelity National Title | |
| Urbina Jose L | -- | None Available | |
| Urbina Shelley E | -- | -- | |
| Rodin Aaron | $190,000 | -- |
Source: Public Records
Mortgage History
| Date | Status | Borrower | Loan Amount |
|---|---|---|---|
| Open | Jiang Sulun | $340,000 |
Source: Public Records
Tax History Compared to Growth
Tax History
| Year | Tax Paid | Tax Assessment Tax Assessment Total Assessment is a certain percentage of the fair market value that is determined by local assessors to be the total taxable value of land and additions on the property. | Land | Improvement |
|---|---|---|---|---|
| 2025 | $10,457 | $610 | $242 | $368 |
| 2024 | $1,368 | $656 | $260 | $396 |
| 2023 | $10,067 | $692 | $274 | $418 |
| 2022 | $10,067 | $692 | $274 | $418 |
| 2021 | $13,315 | $664 | $267 | $397 |
| 2020 | $5,899 | $627 | $405 | $222 |
| 2019 | $1,052 | $671 | $406 | $265 |
| 2018 | $4,826 | $716 | $0 | $0 |
| 2017 | $4,982 | $761 | $409 | $352 |
| 2016 | $6,082 | $806 | $390 | $416 |
| 2015 | $1,264 | $851 | $411 | $440 |
| 2014 | $1,264 | $851 | $411 | $440 |
| 2013 | $1,221 | $896 | $433 | $463 |
Source: Public Records
Map
Nearby Homes
- 26 Depan Ave
- 70 Terrace Ave
- 7 Willis Ave
- 504 6th Ave
- 14 Spooner St
- 199 Tulip Ave
- 17 Concord St
- 505 7th Ave
- 529 8th Ave
- 533 10th Ave
- 545 6th Ave
- 264 Bryant Ave
- 113 N 1st St
- 91 Tulip Ave Unit 2
- 91 Tulip Ave Unit G C2
- 91 Tulip Ave Unit B1-Carnation
- 91 Tulip Ave Unit C2
- 91 Tulip Ave Unit E1
- 91 Tulip Ave Unit B2
- 224 Bryant Ave