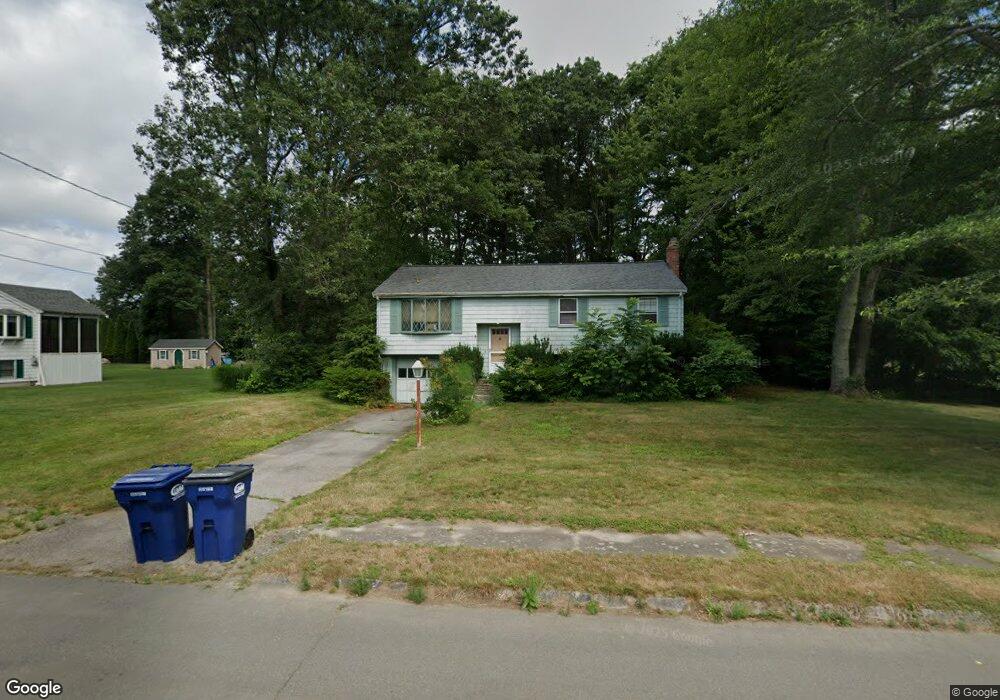
24 Childs Ln Foxboro, MA 02035
Estimated Value: $534,852 - $684,000
3
Beds
1
Bath
1,080
Sq Ft
$553/Sq Ft
Est. Value
About This Home
This home is located at 24 Childs Ln, Foxboro, MA 02035 and is currently estimated at $597,213, approximately $552 per square foot. 24 Childs Ln is a home located in Norfolk County with nearby schools including Foxborough High School, Hands-On-Montessori School, and Cadence Academy Preschool - North Attleborough.
Ownership History
Date
Name
Owned For
Owner Type
Purchase Details
Closed on
Nov 30, 2004
Sold by
Dercole Francis J and Dercole Virginia R
Bought by
Kantzer David C
Current Estimated Value
Home Financials for this Owner
Home Financials are based on the most recent Mortgage that was taken out on this home.
Original Mortgage
$207,500
Outstanding Balance
$104,055
Interest Rate
5.75%
Mortgage Type
Purchase Money Mortgage
Estimated Equity
$493,158
Create a Home Valuation Report for This Property
The Home Valuation Report is an in-depth analysis detailing your home's value as well as a comparison with similar homes in the area
Home Values in the Area
Average Home Value in this Area
Purchase History
| Date | Buyer | Sale Price | Title Company |
|---|---|---|---|
| Kantzer David C | $335,000 | -- |
Source: Public Records
Mortgage History
| Date | Status | Borrower | Loan Amount |
|---|---|---|---|
| Open | Kantzer David C | $207,500 |
Source: Public Records
Tax History Compared to Growth
Tax History
| Year | Tax Paid | Tax Assessment Tax Assessment Total Assessment is a certain percentage of the fair market value that is determined by local assessors to be the total taxable value of land and additions on the property. | Land | Improvement |
|---|---|---|---|---|
| 2025 | $6,133 | $463,900 | $241,600 | $222,300 |
| 2024 | $6,012 | $445,000 | $246,000 | $199,000 |
| 2023 | $5,866 | $412,800 | $234,200 | $178,600 |
| 2022 | $5,259 | $362,200 | $196,300 | $165,900 |
| 2021 | $4,900 | $332,400 | $181,800 | $150,600 |
| 2020 | $4,584 | $314,600 | $181,800 | $132,800 |
| 2019 | $4,504 | $306,400 | $173,100 | $133,300 |
| 2018 | $4,388 | $301,200 | $173,100 | $128,100 |
| 2017 | $4,461 | $296,600 | $161,800 | $134,800 |
| 2016 | $4,523 | $305,200 | $163,100 | $142,100 |
| 2015 | $4,297 | $282,900 | $137,900 | $145,000 |
| 2014 | $4,106 | $273,900 | $128,900 | $145,000 |
Source: Public Records
Map
Nearby Homes