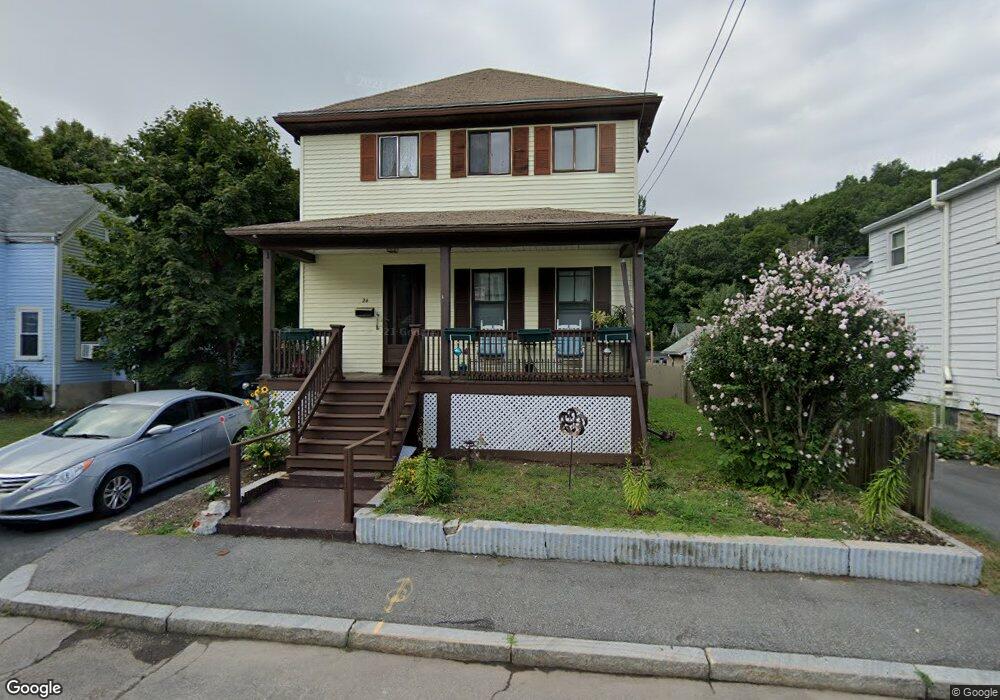
24 Cliff St Malden, MA 02148
Forestdale NeighborhoodEstimated Value: $972,000 - $1,260,480
7
Beds
4
Baths
3,044
Sq Ft
$382/Sq Ft
Est. Value
About This Home
This home is located at 24 Cliff St, Malden, MA 02148 and is currently estimated at $1,161,370, approximately $381 per square foot. 24 Cliff St is a home located in Middlesex County with nearby schools including Malden High School, Cheverus Catholic School, and Malden Catholic.
Ownership History
Date
Name
Owned For
Owner Type
Purchase Details
Closed on
Sep 22, 2016
Sold by
Forti Bernadette M and Forti Andrew T
Bought by
Bucciero Patricia and Cordeiro Manuel
Current Estimated Value
Home Financials for this Owner
Home Financials are based on the most recent Mortgage that was taken out on this home.
Original Mortgage
$304,000
Outstanding Balance
$242,979
Interest Rate
3.45%
Mortgage Type
New Conventional
Estimated Equity
$918,391
Purchase Details
Closed on
Jun 8, 2010
Sold by
Forti Jeanne M and Forti Bernadette M
Bought by
Forti Bernadette M and Forti Andrew T
Purchase Details
Closed on
Dec 10, 2007
Sold by
Toro Claudette J
Bought by
Forti Andrew J and Forti Bernadette M
Create a Home Valuation Report for This Property
The Home Valuation Report is an in-depth analysis detailing your home's value as well as a comparison with similar homes in the area
Home Values in the Area
Average Home Value in this Area
Purchase History
| Date | Buyer | Sale Price | Title Company |
|---|---|---|---|
| Bucciero Patricia | $380,000 | -- | |
| Forti Bernadette M | -- | -- | |
| Forti Andrew J | -- | -- |
Source: Public Records
Mortgage History
| Date | Status | Borrower | Loan Amount |
|---|---|---|---|
| Open | Bucciero Patricia | $304,000 |
Source: Public Records
Tax History Compared to Growth
Tax History
| Year | Tax Paid | Tax Assessment Tax Assessment Total Assessment is a certain percentage of the fair market value that is determined by local assessors to be the total taxable value of land and additions on the property. | Land | Improvement |
|---|---|---|---|---|
| 2025 | $123 | $1,084,600 | $435,400 | $649,200 |
| 2024 | $11,962 | $1,023,300 | $411,800 | $611,500 |
| 2023 | $11,296 | $926,700 | $376,600 | $550,100 |
| 2022 | $10,799 | $874,400 | $341,300 | $533,100 |
| 2021 | $10,386 | $845,100 | $312,000 | $533,100 |
| 2020 | $9,967 | $787,900 | $296,700 | $491,200 |
| 2019 | $7,009 | $528,200 | $282,600 | $245,600 |
| 2018 | $6,531 | $463,500 | $238,500 | $225,000 |
| 2017 | $6,409 | $452,300 | $238,500 | $213,800 |
| 2016 | $6,375 | $420,500 | $226,800 | $193,700 |
| 2015 | $6,212 | $394,900 | $213,900 | $181,000 |
| 2014 | $5,943 | $369,100 | $194,500 | $174,600 |
Source: Public Records
Map
Nearby Homes