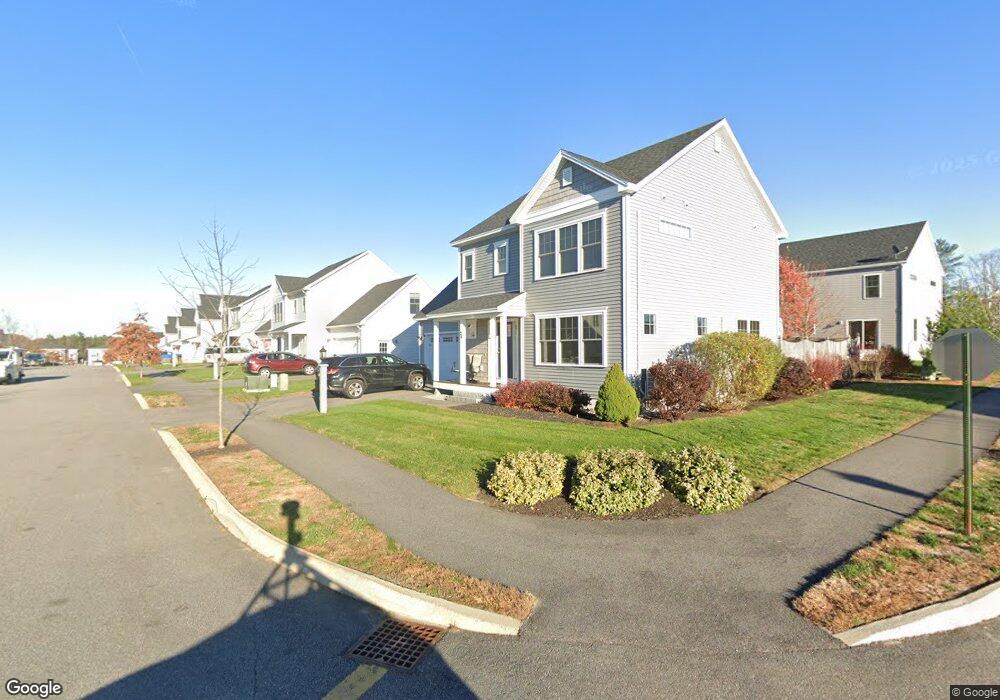
24 Clipper St Cumberland Foreside, ME 04110
Cumberland Foreside NeighborhoodEstimated Value: $758,000 - $796,074
3
Beds
3
Baths
1,892
Sq Ft
$410/Sq Ft
Est. Value
About This Home
This home is located at 24 Clipper St, Cumberland Foreside, ME 04110 and is currently estimated at $776,519, approximately $410 per square foot. 24 Clipper St is a home with nearby schools including Mabel I. Wilson School, Greely Middle School 4-5, and Greely Middle School.
Ownership History
Date
Name
Owned For
Owner Type
Purchase Details
Closed on
Aug 31, 2022
Sold by
Bowker Susan H and Bowker Roger C
Bought by
Moon Sung M and Ma Kab R
Current Estimated Value
Home Financials for this Owner
Home Financials are based on the most recent Mortgage that was taken out on this home.
Original Mortgage
$468,750
Outstanding Balance
$447,651
Interest Rate
5.54%
Mortgage Type
Purchase Money Mortgage
Estimated Equity
$328,868
Purchase Details
Closed on
Mar 19, 2021
Sold by
Duncanson Nannette M and Duncanson Arthur E
Bought by
Bowker Roger C and Bowker Susan H
Home Financials for this Owner
Home Financials are based on the most recent Mortgage that was taken out on this home.
Original Mortgage
$225,000
Interest Rate
2.7%
Mortgage Type
Purchase Money Mortgage
Purchase Details
Closed on
Nov 21, 2016
Sold by
Graiver Homes Llc
Bought by
Duncanson Arthur E and Duncanson Nannette M
Create a Home Valuation Report for This Property
The Home Valuation Report is an in-depth analysis detailing your home's value as well as a comparison with similar homes in the area
Home Values in the Area
Average Home Value in this Area
Purchase History
| Date | Buyer | Sale Price | Title Company |
|---|---|---|---|
| Moon Sung M | $625,000 | None Available | |
| Moon Sung M | $625,000 | None Available | |
| Moon Sung M | $625,000 | None Available | |
| Moon Sung M | $625,000 | None Available | |
| Bowker Roger C | -- | None Available | |
| Bowker Roger C | -- | None Available | |
| Bowker Roger C | -- | None Available | |
| Bowker Roger C | -- | None Available | |
| Duncanson Arthur E | -- | -- | |
| Duncanson Arthur E | -- | -- | |
| Duncanson Arthur E | -- | -- | |
| Duncanson Arthur E | -- | -- |
Source: Public Records
Mortgage History
| Date | Status | Borrower | Loan Amount |
|---|---|---|---|
| Open | Moon Sung M | $468,750 | |
| Closed | Moon Sung M | $468,750 | |
| Previous Owner | Bowker Roger C | $225,000 |
Source: Public Records
Tax History
| Year | Tax Paid | Tax Assessment Tax Assessment Total Assessment is a certain percentage of the fair market value that is determined by local assessors to be the total taxable value of land and additions on the property. | Land | Improvement |
|---|---|---|---|---|
| 2025 | $8,478 | $336,700 | $76,100 | $260,600 |
| 2024 | $7,828 | $336,700 | $76,100 | $260,600 |
| 2023 | $7,458 | $336,700 | $76,100 | $260,600 |
| 2022 | $7,138 | $336,700 | $76,100 | $260,600 |
| 2021 | $6,609 | $321,600 | $76,100 | $245,500 |
| 2020 | $6,545 | $321,600 | $76,100 | $245,500 |
| 2019 | $6,384 | $321,600 | $76,100 | $245,500 |
| 2018 | $6,336 | $321,600 | $76,100 | $245,500 |
| 2017 | $0 | $60,900 | $60,900 | $0 |
| 2016 | $0 | $0 | $0 | $0 |
Source: Public Records
Map
Nearby Homes
- 52 Maeves Way
- 29 Mary Ln
- 35 Deans Way
- 5 Heritage Ln
- 59 Underwood Rd
- 24 Johnson Rd
- 5 & 6 Harmony Way
- 263 Foreside Rd
- 252 Foreside Rd
- Lot 3 Dunham Ln
- Lot 2 Dunham Ln
- 267 U S Route 1 Unit 308
- 267 U S Route 1 Unit 306
- 11 Coastal Pines Lot 5
- 267 U S 1 Unit 305
- 267 U S 1 Unit 301
- 267 U S 1 Unit 404
- 267 U S 1 Unit 201
- 267 U S 1 Unit 309
- 267 U S 1 Unit PH503
- 24 Clipper St
- 13 Nautical Dr
- 24 Clipper St
- 15 Nautical Dr
- 21 Nautical Dr
- 21 Nautical Dr
- 19 Nautical Dr
- 22 Clipper St
- 20 Nautical Dr
- 17 Nautical Dr
- 17 Nautical Dr Unit Lot 15
- 20 Clipper St
- 21 Clipper St
- 26 Clipper St
- 19 Clipper St
- 26 Clipper St
- 23 Clipper St
- 23 Clipper St Unit Lot 34
- 23 Clipper St
- 17 Clipper St Unit Lot 37
Your Personal Tour Guide
Ask me questions while you tour the home.