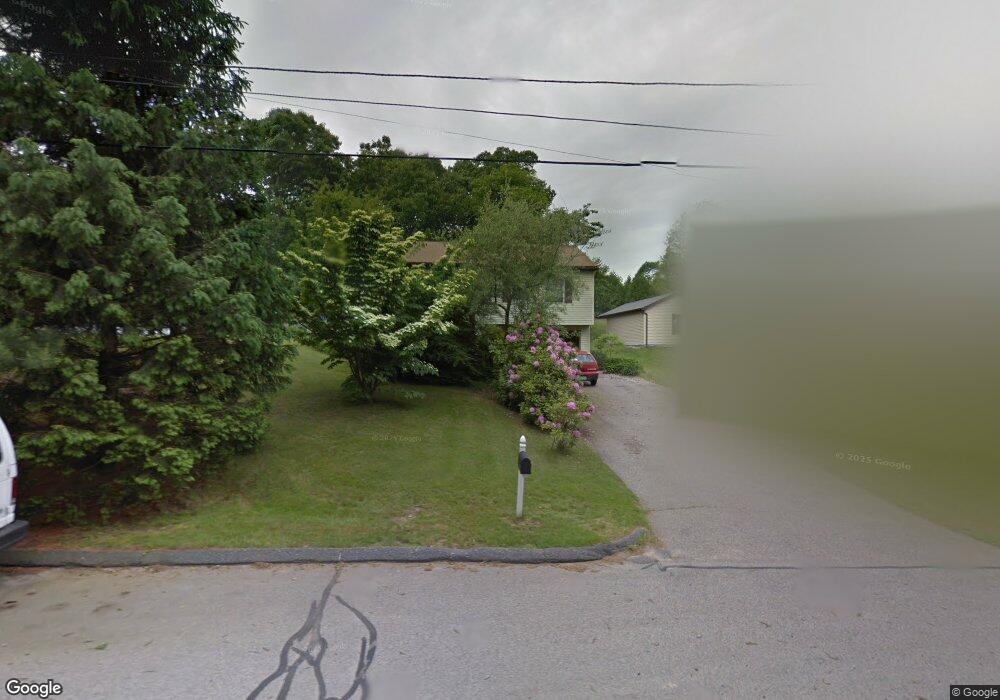
24 Colonial Dr Westerly, RI 02891
Estimated Value: $294,000 - $401,000
2
Beds
1
Bath
924
Sq Ft
$397/Sq Ft
Est. Value
About This Home
This home is located at 24 Colonial Dr, Westerly, RI 02891 and is currently estimated at $367,104, approximately $397 per square foot. 24 Colonial Dr is a home located in Washington County with nearby schools including Westerly High School and St. Michael School.
Ownership History
Date
Name
Owned For
Owner Type
Purchase Details
Closed on
May 21, 2025
Sold by
John P Tarbox Irt and Henderson
Bought by
La-Cruz John D
Current Estimated Value
Home Financials for this Owner
Home Financials are based on the most recent Mortgage that was taken out on this home.
Original Mortgage
$425,000
Outstanding Balance
$421,939
Interest Rate
6.62%
Mortgage Type
Purchase Money Mortgage
Estimated Equity
-$54,835
Purchase Details
Closed on
Feb 7, 2024
Sold by
Tarbox John P
Bought by
John P Tarbor Irt and Jarrett
Purchase Details
Closed on
Mar 2, 2001
Sold by
Bernard Kristen J
Bought by
Tarbox John P
Purchase Details
Closed on
Jul 27, 1993
Sold by
Desantis Giuseppe A and Desantis Gail B
Bought by
Bernard Kristin J
Create a Home Valuation Report for This Property
The Home Valuation Report is an in-depth analysis detailing your home's value as well as a comparison with similar homes in the area
Home Values in the Area
Average Home Value in this Area
Purchase History
| Date | Buyer | Sale Price | Title Company |
|---|---|---|---|
| La-Cruz John D | $280,000 | None Available | |
| La-Cruz John D | $280,000 | None Available | |
| La-Cruz John D | $280,000 | None Available | |
| John P Tarbor Irt | -- | None Available | |
| John P Tarbor Irt | -- | None Available | |
| John P Tarbor Irt | -- | None Available | |
| Tarbox John P | $98,000 | -- | |
| Tarbox John P | $98,000 | -- | |
| Bernard Kristin J | $108,000 | -- | |
| Bernard Kristin J | $108,000 | -- |
Source: Public Records
Mortgage History
| Date | Status | Borrower | Loan Amount |
|---|---|---|---|
| Open | La-Cruz John D | $425,000 | |
| Closed | La-Cruz John D | $425,000 | |
| Previous Owner | Bernard Kristin J | $204,000 | |
| Previous Owner | Bernard Kristin J | $50,000 |
Source: Public Records
Tax History
| Year | Tax Paid | Tax Assessment Tax Assessment Total Assessment is a certain percentage of the fair market value that is determined by local assessors to be the total taxable value of land and additions on the property. | Land | Improvement |
|---|---|---|---|---|
| 2025 | $2,302 | $323,800 | $166,300 | $157,500 |
| 2024 | $2,401 | $244,700 | $119,400 | $125,300 |
| 2023 | $2,354 | $244,700 | $119,400 | $125,300 |
| 2022 | $2,339 | $244,700 | $119,400 | $125,300 |
| 2021 | $2,333 | $202,500 | $104,000 | $98,500 |
| 2020 | $2,290 | $202,500 | $104,000 | $98,500 |
| 2019 | $2,268 | $202,500 | $104,000 | $98,500 |
| 2018 | $2,148 | $180,800 | $104,000 | $76,800 |
| 2017 | $2,095 | $180,800 | $104,000 | $76,800 |
| 2016 | $2,112 | $180,800 | $104,000 | $76,800 |
| 2015 | $2,070 | $191,300 | $111,200 | $80,100 |
| 2014 | $2,035 | $191,300 | $111,200 | $80,100 |
Source: Public Records
Map
Nearby Homes
- 0 Iroquois Ave
- 19 Apache Dr Unit F
- 19 Apache Dr Unit 19C
- 12 Apache Dr Unit A
- 17 Apache Dr Unit G
- 2 Marichris Dr
- 52 Bellevue Ave
- 12 Batterson Ave
- 5 Marion St
- 14 George St
- 16 Spring St
- 25 School St Unit 2
- 7 Dixon St
- 17 West St Unit 3
- 33 Whipple Ave
- 7 Schilke Dr
- 199 High St
- 21 North Dr
- 55 Pleasant St
- 19 Crestview Dr Unit C
Your Personal Tour Guide
Ask me questions while you tour the home.