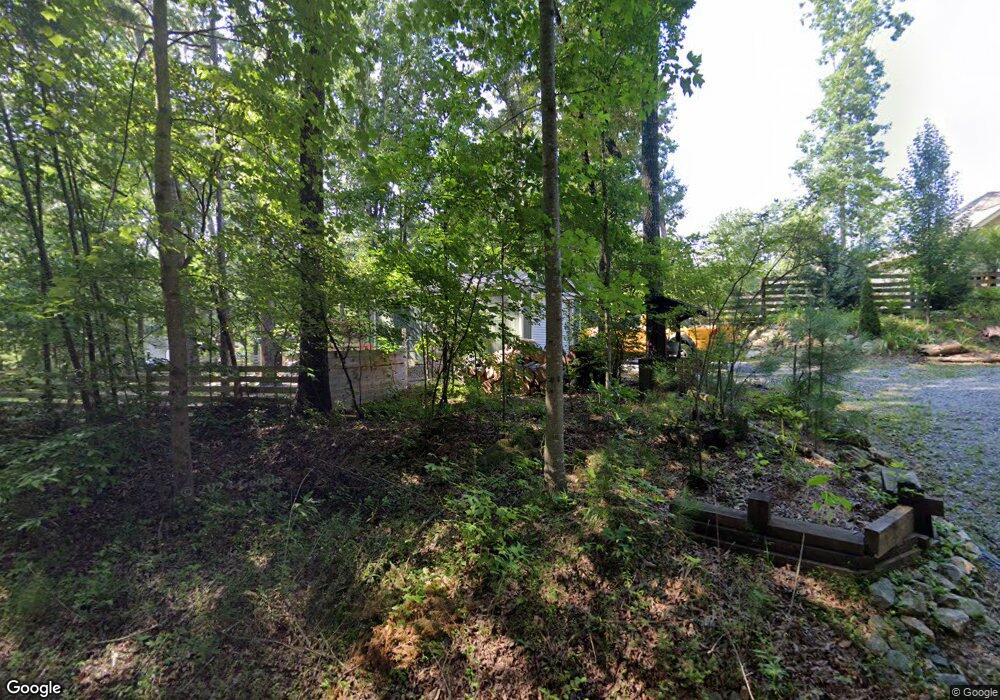
24 Cripple Creek Rd Ellijay, GA 30536
Estimated Value: $416,503 - $456,000
--
Bed
--
Bath
1,252
Sq Ft
$350/Sq Ft
Est. Value
About This Home
This home is located at 24 Cripple Creek Rd, Ellijay, GA 30536 and is currently estimated at $438,626, approximately $350 per square foot. 24 Cripple Creek Rd is a home with nearby schools including Ellijay Elementary School, Clear Creek Elementary School, and Clear Creek Middle School.
Ownership History
Date
Name
Owned For
Owner Type
Purchase Details
Closed on
Sep 2, 2020
Sold by
4 Seasons Custom Homes Inc
Bought by
Tissier Bonnie and Torregrossa John
Current Estimated Value
Purchase Details
Closed on
Jun 25, 2020
Sold by
4 Seasons Custom Homes Inc
Bought by
Coester Emma Lee and Mccool Sandra Lee
Purchase Details
Closed on
May 29, 2020
Sold by
4 Seasons Custom Homes Inc
Bought by
Lanier Trevor and Seagle Kiersten
Purchase Details
Closed on
Feb 7, 2020
Sold by
4 Seasons Custom Homes Inc
Bought by
Aispuro Victor M and Aispuro Yolanda
Home Financials for this Owner
Home Financials are based on the most recent Mortgage that was taken out on this home.
Original Mortgage
$183,600
Interest Rate
3.6%
Mortgage Type
New Conventional
Purchase Details
Closed on
Jul 8, 2019
Sold by
Rangel Fidel
Bought by
4 Seasons Custom Homes Inc
Purchase Details
Closed on
Oct 3, 2018
Sold by
Masters Billy F
Bought by
Rangel Fidel
Create a Home Valuation Report for This Property
The Home Valuation Report is an in-depth analysis detailing your home's value as well as a comparison with similar homes in the area
Home Values in the Area
Average Home Value in this Area
Purchase History
| Date | Buyer | Sale Price | Title Company |
|---|---|---|---|
| Tissier Bonnie | $239,000 | -- | |
| Coester Emma Lee | $215,000 | -- | |
| Lanier Trevor | $199,900 | -- | |
| Aispuro Victor M | $204,000 | -- | |
| 4 Seasons Custom Homes Inc | $67,000 | -- | |
| Rangel Fidel | $45,000 | -- |
Source: Public Records
Mortgage History
| Date | Status | Borrower | Loan Amount |
|---|---|---|---|
| Previous Owner | Aispuro Victor M | $183,600 |
Source: Public Records
Tax History Compared to Growth
Tax History
| Year | Tax Paid | Tax Assessment Tax Assessment Total Assessment is a certain percentage of the fair market value that is determined by local assessors to be the total taxable value of land and additions on the property. | Land | Improvement |
|---|---|---|---|---|
| 2025 | $586 | $161,640 | $14,400 | $147,240 |
| 2024 | $586 | $159,200 | $14,000 | $145,200 |
| 2023 | $602 | $159,200 | $14,000 | $145,200 |
| 2022 | $627 | $139,720 | $14,000 | $125,720 |
| 2021 | $663 | $93,560 | $10,000 | $83,560 |
| 2020 | $1,657 | $75,320 | $33,600 | $41,720 |
| 2019 | $326 | $14,400 | $14,400 | $0 |
| 2018 | $220 | $9,600 | $9,600 | $0 |
| 2017 | $236 | $9,600 | $9,600 | $0 |
| 2016 | $251 | $10,000 | $10,000 | $0 |
| 2015 | $229 | $9,280 | $9,280 | $0 |
| 2014 | $238 | $9,280 | $9,280 | $0 |
| 2013 | -- | $9,280 | $9,280 | $0 |
Source: Public Records
Map
Nearby Homes
- 306 Cripple Creek Ln
- 0 Yukon Rd Unit 7507385
- 0 Yukon Rd Unit 10442733
- 431 Clear Creek Rd
- 0 Old Pleasant Valley Rd Unit 7671835
- 0 Old Pleasant Valley Rd Unit 10622779
- 0 John Call Rd
- 2089 John Call Rd
- 1907 John Call Rd
- 0 Orchard Ln Unit 10579458
- 0 Orchard Ln Unit 7627264
- 144 Ridgeback Rd
- 00 Wildwood Trail
- 270 Milford Trail
- 152 Wendy Hill Rd
- 0 John Call Rd Unit 10646302
- 0 John Call Rd Unit 420371
- 0 John Call Rd Unit 7683545
- 409 Owensby Mill Dr
- 449 Owensby Mill Dr
- 4674 Yukon Rd
- 4798 Yukon Rd
- 4803 Yukon Rd
- 4629 Yukon Rd
- 4638 Yukon Rd
- 4642 Yukon Rd
- 4670 Yukon Rd
- 4670 Yukon Rd Unit 2
- 4670 Yukon Rd
- 4804 Yukon Rd
- 70 Cripple Creek Dr
- 22 Cripple Creek Dr
- 4808 Yukon Rd
- 4572 Yukon Rd
- 4806 Yukon Rd
- 100 Cripple Creek Dr
- 73 Teem Rd
- 53 Cripple Creek Ln
- 266 Ivy Cove Ln
- 282 Ivy Cove Ln