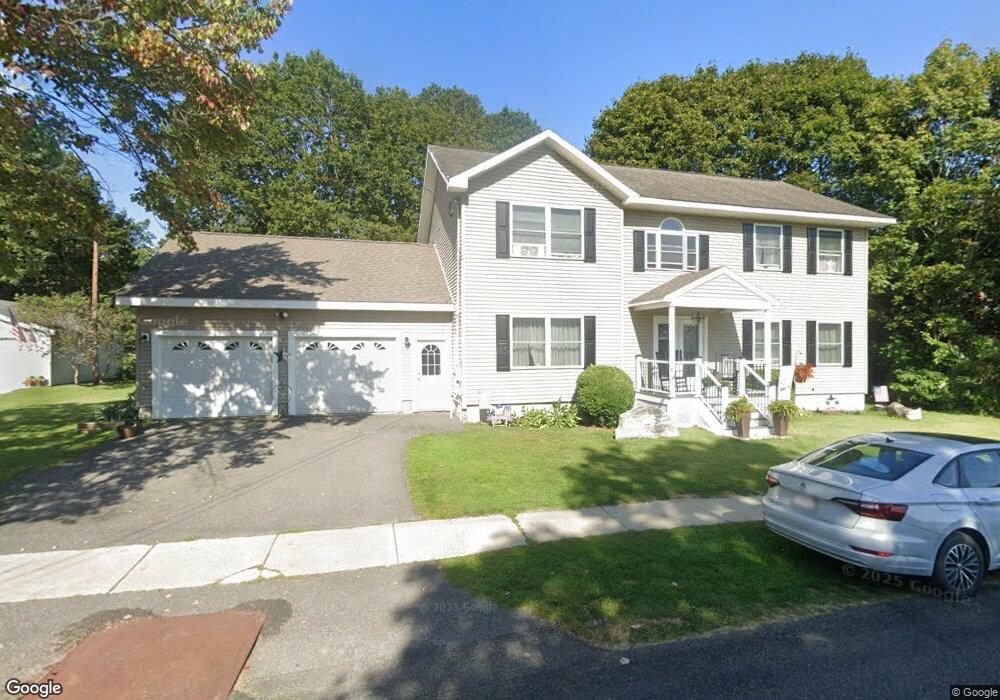
24 Dean St Cheshire, MA 01225
Estimated Value: $395,000 - $457,000
3
Beds
3
Baths
2,460
Sq Ft
$170/Sq Ft
Est. Value
About This Home
This home is located at 24 Dean St, Cheshire, MA 01225 and is currently estimated at $417,199, approximately $169 per square foot. 24 Dean St is a home located in Berkshire County with nearby schools including Hoosac Valley Middle & High School and Berkshire Arts & Technology Charter Public School.
Ownership History
Date
Name
Owned For
Owner Type
Purchase Details
Closed on
Aug 20, 2004
Sold by
Gwozdz Edward and Gwozdz Margaret
Bought by
Mcmahon Sean M and Mcmahon Kerry A
Current Estimated Value
Home Financials for this Owner
Home Financials are based on the most recent Mortgage that was taken out on this home.
Original Mortgage
$145,000
Outstanding Balance
$71,537
Interest Rate
6.03%
Mortgage Type
Purchase Money Mortgage
Estimated Equity
$345,662
Create a Home Valuation Report for This Property
The Home Valuation Report is an in-depth analysis detailing your home's value as well as a comparison with similar homes in the area
Home Values in the Area
Average Home Value in this Area
Purchase History
| Date | Buyer | Sale Price | Title Company |
|---|---|---|---|
| Mcmahon Sean M | $20,000 | -- | |
| Mcmahon Sean M | $20,000 | -- |
Source: Public Records
Mortgage History
| Date | Status | Borrower | Loan Amount |
|---|---|---|---|
| Open | Mcmahon Sean M | $145,000 | |
| Closed | Mcmahon Sean M | $145,000 |
Source: Public Records
Tax History Compared to Growth
Tax History
| Year | Tax Paid | Tax Assessment Tax Assessment Total Assessment is a certain percentage of the fair market value that is determined by local assessors to be the total taxable value of land and additions on the property. | Land | Improvement |
|---|---|---|---|---|
| 2025 | $4,500 | $404,300 | $46,300 | $358,000 |
| 2024 | $4,454 | $385,000 | $44,200 | $340,800 |
| 2023 | $4,204 | $351,200 | $46,900 | $304,300 |
| 2022 | $3,629 | $284,400 | $49,300 | $235,100 |
| 2021 | $3,649 | $272,900 | $46,900 | $226,000 |
| 2020 | $3,666 | $272,800 | $46,900 | $225,900 |
| 2019 | $3,574 | $272,800 | $43,500 | $229,300 |
| 2018 | $0 | $261,900 | $43,500 | $218,400 |
| 2017 | $3,245 | $261,900 | $43,500 | $218,400 |
| 2016 | $3,211 | $261,900 | $43,500 | $218,400 |
| 2015 | $3,092 | $259,000 | $38,800 | $220,200 |
Source: Public Records
Map
Nearby Homes