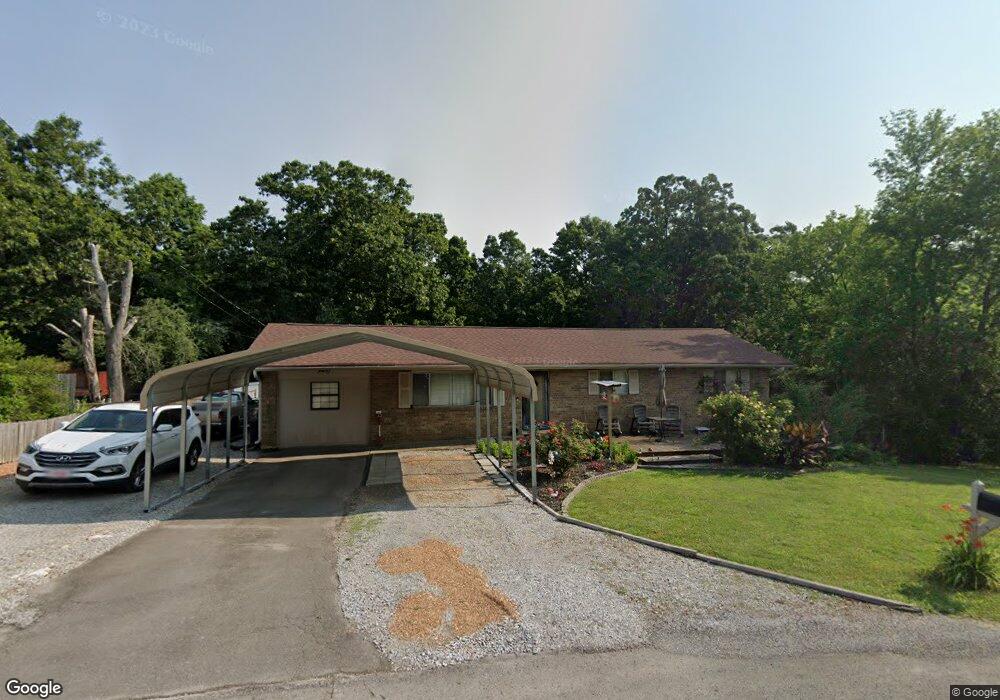
24 Dee Vue Ln Rossville, GA 30741
Estimated Value: $177,343 - $227,000
--
Bed
2
Baths
1,500
Sq Ft
$142/Sq Ft
Est. Value
About This Home
This home is located at 24 Dee Vue Ln, Rossville, GA 30741 and is currently estimated at $212,836, approximately $141 per square foot. 24 Dee Vue Ln is a home located in Walker County with nearby schools including Stone Creek Elementary School, Rossville Middle School, and Ridgeland High School.
Ownership History
Date
Name
Owned For
Owner Type
Purchase Details
Closed on
Aug 24, 1992
Sold by
Murdock Mark H and Murdock Patricia
Bought by
Seals David W and Seals Connie L
Current Estimated Value
Purchase Details
Closed on
Jul 2, 1991
Sold by
Alexander G Steven
Bought by
Murdock Mark H and Murdock Patricia
Purchase Details
Closed on
Jan 4, 1983
Sold by
Dunn William Curtis
Bought by
Alexander G Steven
Purchase Details
Closed on
Feb 12, 1982
Sold by
Alexander Alexander G and Alexander Debra
Bought by
Dunn William Curtis
Purchase Details
Closed on
Nov 20, 1978
Sold by
Cox Amos C and Cox Ruth
Bought by
Alexander Alexander G and Alexander Debra
Purchase Details
Closed on
Mar 7, 1978
Sold by
Vancleave Gwyn L and Vancleave Irene A
Bought by
Cox Amos C and Cox Ruth
Purchase Details
Closed on
Feb 18, 1977
Bought by
Vancleave Gwyn L and Vancleave Irene A
Create a Home Valuation Report for This Property
The Home Valuation Report is an in-depth analysis detailing your home's value as well as a comparison with similar homes in the area
Home Values in the Area
Average Home Value in this Area
Purchase History
| Date | Buyer | Sale Price | Title Company |
|---|---|---|---|
| Seals David W | $47,500 | -- | |
| Murdock Mark H | -- | -- | |
| Alexander G Steven | $13,200 | -- | |
| Dunn William Curtis | $13,600 | -- | |
| Alexander Alexander G | -- | -- | |
| Cox Amos C | -- | -- | |
| Vancleave Gwyn L | -- | -- |
Source: Public Records
Tax History Compared to Growth
Tax History
| Year | Tax Paid | Tax Assessment Tax Assessment Total Assessment is a certain percentage of the fair market value that is determined by local assessors to be the total taxable value of land and additions on the property. | Land | Improvement |
|---|---|---|---|---|
| 2024 | $1,408 | $60,967 | $3,612 | $57,355 |
| 2023 | $1,367 | $57,843 | $3,612 | $54,231 |
| 2022 | $1,264 | $49,948 | $3,612 | $46,336 |
| 2021 | $1,129 | $40,058 | $3,612 | $36,446 |
| 2020 | $951 | $32,016 | $3,612 | $28,404 |
| 2019 | $967 | $32,016 | $3,612 | $28,404 |
| 2018 | $847 | $32,016 | $3,612 | $28,404 |
| 2017 | $1,056 | $32,016 | $3,612 | $28,404 |
| 2016 | $864 | $32,016 | $3,612 | $28,404 |
| 2015 | $908 | $31,862 | $4,084 | $27,778 |
| 2014 | $818 | $31,862 | $4,084 | $27,778 |
| 2013 | -- | $31,862 | $4,084 | $27,778 |
Source: Public Records
Map
Nearby Homes
- 25 Carolyn Ln
- 24 Newman Dr
- 13 Travis Rd
- 4 Newman Dr
- 321 Jewell Ln
- 2 & 4 Newman Dr
- 2 Newman Dr
- 3 Fisher Rd
- 57 Circle Dr
- 51 Circle Dr
- 408 N Jenkins Rd
- 353 N Jenkins Rd
- 32 Kent Dr
- 323 N Jenkins Rd
- 13 Circle Dr
- 535 E Garden Farm Rd
- 545 E Garden Farm Rd
- 0 Sunset Cir Unit 1517664
- 0 Sunset Cir Unit 1524868
- 145 Mission Ridge Rd