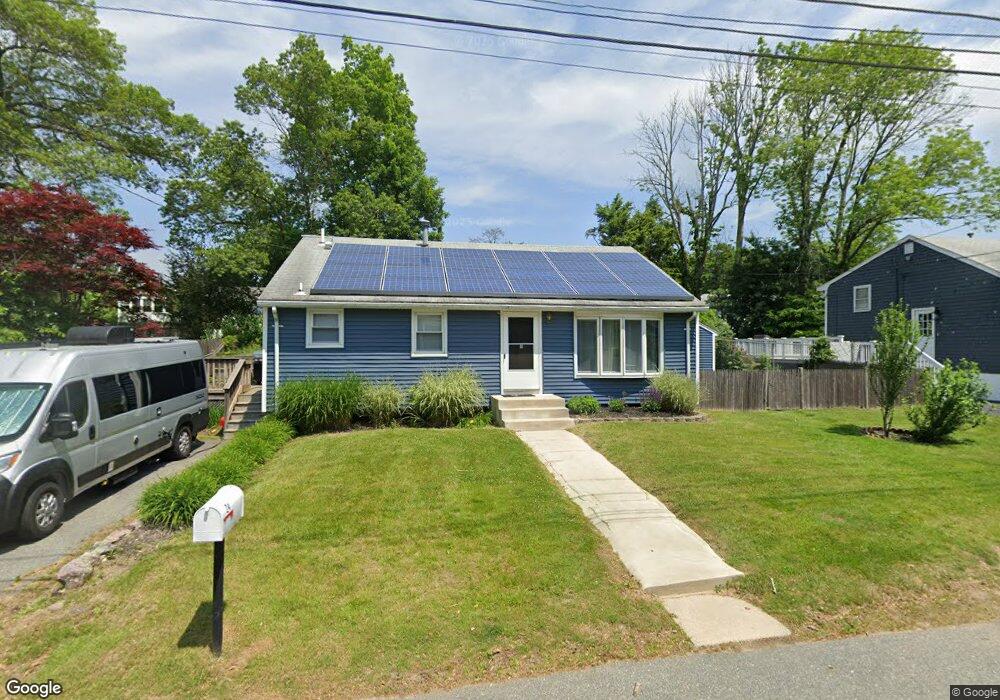
24 Digby Ave Brockton, MA 02301
Estimated Value: $446,000 - $534,000
3
Beds
1
Bath
1,580
Sq Ft
$313/Sq Ft
Est. Value
About This Home
This home is located at 24 Digby Ave, Brockton, MA 02301 and is currently estimated at $494,876, approximately $313 per square foot. 24 Digby Ave is a home located in Plymouth County with nearby schools including Hancock Elementary School, Manthala George Jr. School, and Louis F Angelo Elementary School.
Ownership History
Date
Name
Owned For
Owner Type
Purchase Details
Closed on
Apr 5, 2022
Sold by
Glover Keisha
Bought by
Our Propertys Llc
Current Estimated Value
Home Financials for this Owner
Home Financials are based on the most recent Mortgage that was taken out on this home.
Original Mortgage
$384,000
Outstanding Balance
$362,253
Interest Rate
4.67%
Mortgage Type
Commercial
Estimated Equity
$132,623
Purchase Details
Closed on
Jul 8, 2021
Sold by
Best Marylou P
Bought by
Glover Keisha
Purchase Details
Closed on
Apr 27, 1999
Sold by
Anderson Allan R and Anderson Anne M
Bought by
Best Geroge J and Best Marylou P
Purchase Details
Closed on
Jun 12, 1991
Sold by
Tesoro Thomas F and Tesoro Marie G
Bought by
Anderson Allan R and Tesoro Anne M
Create a Home Valuation Report for This Property
The Home Valuation Report is an in-depth analysis detailing your home's value as well as a comparison with similar homes in the area
Home Values in the Area
Average Home Value in this Area
Purchase History
| Date | Buyer | Sale Price | Title Company |
|---|---|---|---|
| Our Propertys Llc | -- | None Available | |
| Our Propertys Llc | -- | None Available | |
| Glover Keisha | $362,500 | None Available | |
| Best Geroge J | $122,500 | -- | |
| Anderson Allan R | $88,000 | -- | |
| Best Geroge J | $122,500 | -- | |
| Anderson Allan R | $88,000 | -- |
Source: Public Records
Mortgage History
| Date | Status | Borrower | Loan Amount |
|---|---|---|---|
| Open | Our Propertys Llc | $384,000 | |
| Closed | Our Propertys Llc | $384,000 | |
| Previous Owner | Anderson Allan R | $288,112 | |
| Previous Owner | Anderson Allan R | $89,247 |
Source: Public Records
Tax History Compared to Growth
Tax History
| Year | Tax Paid | Tax Assessment Tax Assessment Total Assessment is a certain percentage of the fair market value that is determined by local assessors to be the total taxable value of land and additions on the property. | Land | Improvement |
|---|---|---|---|---|
| 2025 | $4,792 | $395,700 | $144,300 | $251,400 |
| 2024 | $4,706 | $391,500 | $144,300 | $247,200 |
| 2023 | $4,539 | $349,700 | $109,100 | $240,600 |
| 2022 | $4,606 | $329,700 | $99,100 | $230,600 |
| 2021 | $4,433 | $305,700 | $92,300 | $213,400 |
| 2020 | $4,337 | $286,300 | $88,500 | $197,800 |
| 2019 | $4,062 | $261,400 | $82,300 | $179,100 |
| 2018 | $3,585 | $237,100 | $82,300 | $154,800 |
| 2017 | $3,585 | $222,700 | $82,300 | $140,400 |
| 2016 | $3,620 | $208,500 | $78,400 | $130,100 |
| 2015 | $3,648 | $201,000 | $78,400 | $122,600 |
| 2014 | $3,069 | $169,300 | $78,400 | $90,900 |
Source: Public Records
Map
Nearby Homes